Breakouts of long bases on strong volume are frequent harbingers of continued price appreciation. Another harbinger, after the initial up-leg, is a low-volume, orderly pullback towards support.
Kendle International (KNDL)
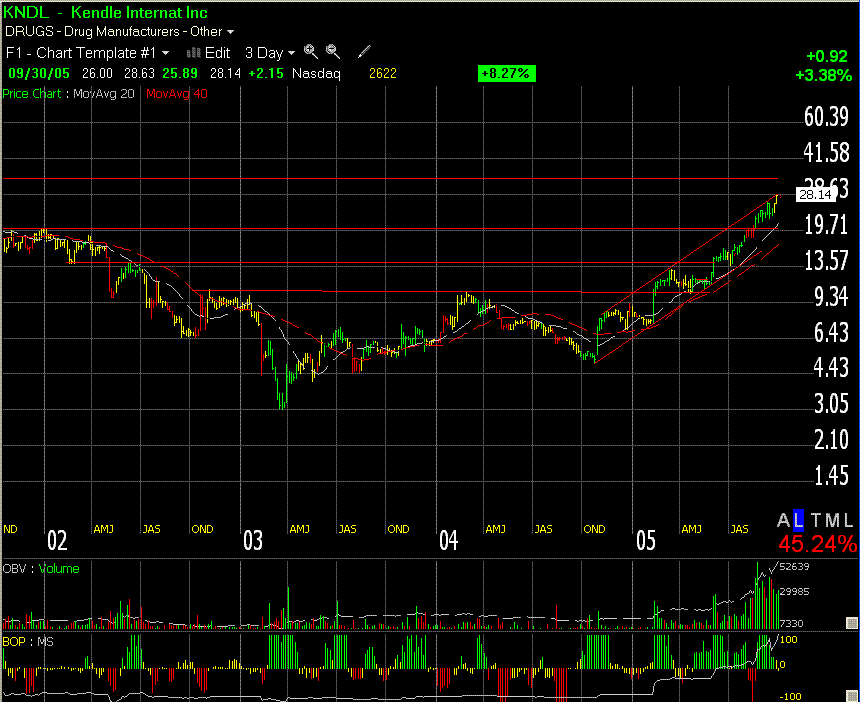
An analysis of Kendle International's chart illustrates this strategy. As the daily chart indicates, Kendle in February 2005 broke out of a base pattern that extended back almost two years. Some traders, who missed entering early, may have given up on the stock when it doubled by late June, but a closer look at the chart shows why it had more room to move.
Kendle's pullbacks were orderly, coming on lower volume and holding near its moving averages, a key sign of more upside to come. Only once did its pullback break beneath the 40-day moving average (in mid-April), but on extremely low volume. Otherwise, as the daily chart indicates, each pullback hugged the 21-day moving average, or, at worst, as in early July, touched the 40-day.
The pattern was breakout (February), flag, breakout (June), flag, breakout (July), flag, breakout (August), flag and a breakout again in September, where it closed the month at $28.14, more than 3 1/2 times its price before the February breakout. Volume on each pullback was a small fraction of the level of the breakout, and a shallow decline just grazing the moving averages suggested a continuation of the uptrend.

As a stock in a rising pattern pulls back, look for several factors to portend the continuation of the pattern. First, look for very low volume on the pullback – between 10% and 25% of the average volume of the last 90 days. Second, watch for the decline to flatten near the 21- or 40-day moving average on the hourly charts in a quiet, narrow flag-type formation.
When the breakout comes, buy on the initial thrust out of this flag pattern. This means a sudden dramatic change in price accompanied by heavy volume. The price doesn't necessarily have to rise above the top of the flagpole (i.e., the previous rally high prior to the consolidation), but only needs to be a bar that is at least several times the size of the previous several bars on the chart.
Wait to add to the position until the stock takes out the top of the flagpole, which is key short-term resistance. This will protect against a head fake, which is a move that starts out dramatically but quickly fizzles price- and volume-wise after just a bar or two and has no follow-through and in particular does not make it through the top of the flag pole.
Set a stop below the bottom of the lowest level reached during formation of the consolidation or flag pattern out of which it has broken.
Kendle, after pulling back on low volume in late-March and April, flattened for a month at its moving averages just under 12. In early June it broke out through 12 towards its previous rally high near 13 and was contained there for a few days before breaking through that key resistance zone and never looking back.
We got into Kendle at that 13 level, the top of the flag pole, on June 5 and rode it up until the pullback in August at around 19. We had a set a price target near prior overhead resistance at around 20 going back to the start of 2002, and when that level contained the stock we exited, happy to take a 50% trade. We are also short-term traders, looking for quick (1-week to 1-month) round trips out of the ebbs and flows of breakouts and consolidations. Kendle went on to hold its 21-day moving average at around 18, and rally from there to nearly 29 by the end of September.
The Kendle example illustrates the potential that chart patterns such as high-volume breakouts from long bases and low-volume flags can have in predicting price appreciation.
Energy Conversion Devices (ENER)
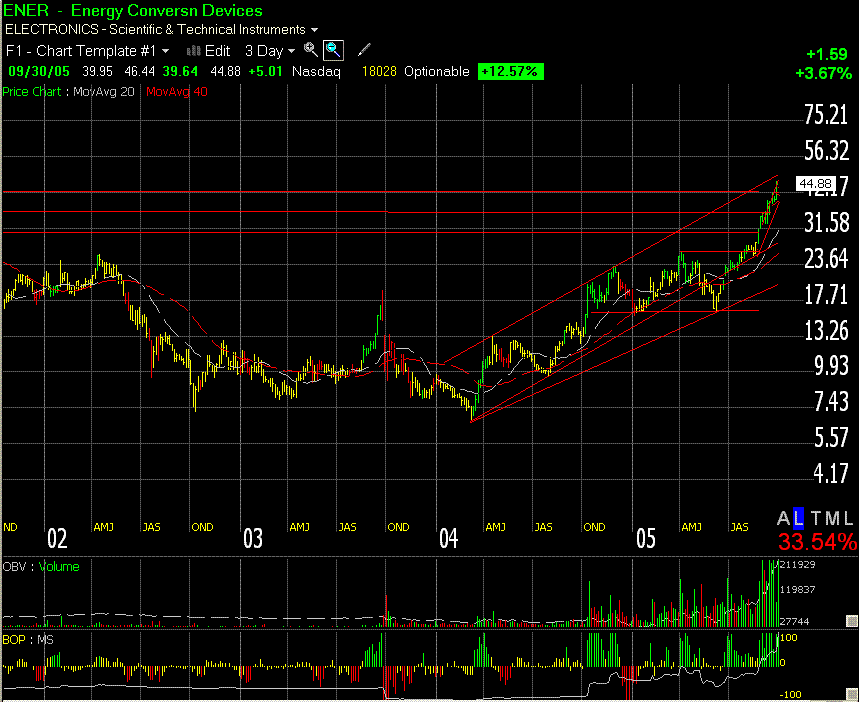
Another strong illustration is Energy Conversion Devices. After a surge out of a nearly two-year base pattern in the fall of 2004 that doubled the share price to over 20, ENER then hit a plateau for six months before breaking out again in June of this year.
We got into the stock on June 14 at 18.28, just as it was crossing back over its 21-day moving average and its late-May rally high. Such a crossover is a bullish sign, and as mentioned takeouts of prior rally highs are good points to enter. Like with Kendle, we exited after a 50% gain, at 27.50 on August 9. The stock had only slightly broken its long-term resistance level at 27 going back to 2002, but wasn't thrusting on heavy volume and seemed due for a retracement. In fact, this was about the high for the rally, and the stock did consolidate somewhat. Our mistake was not to re-enter when it broke out above that level a couple weeks later on its way to close September at 44.46 -- and doing so while never once breaking even its 21-day moving average!

Dynamic Materials (BOOM)
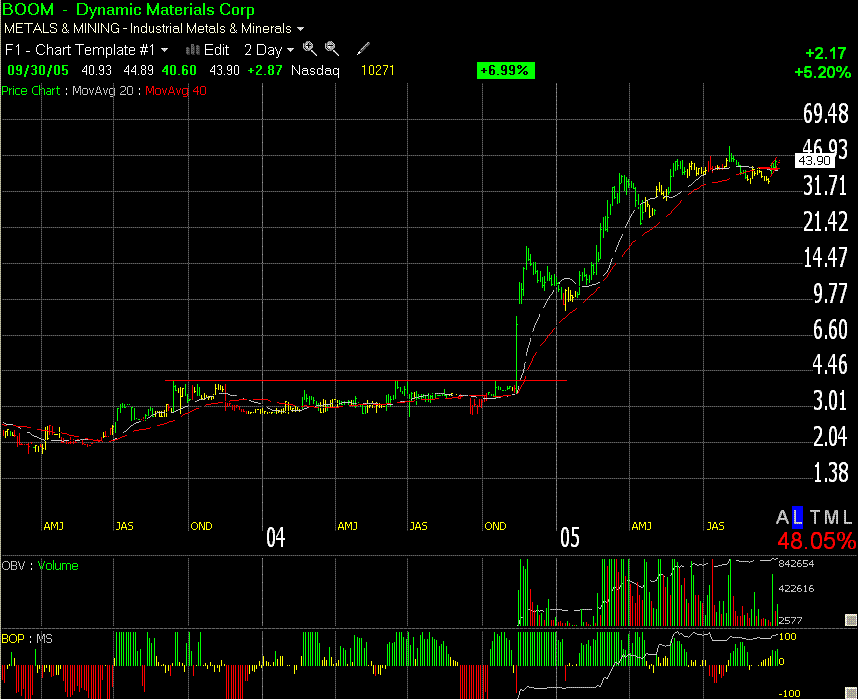
Sometimes, breakouts can happen so quickly that traders need to wait for the move to exhale a bit. In the case of Dynamic Materials, the stock gapped up from the mid-3's to over 17 in November 2004. There was very little time to catch that move. However, once the stock flagged and then began to break out again in February -- and surpassed the previous rally high prior to the consolidation (i.e., the top of the flag pole) at around 16 -- the pattern was screaming, "Buy!"
We actually didn't spot BOOM until the next flag in the 30 zone, where we traded it twice for two quick 20% trades. We bought on a consolidation to a split-adjusted 31.75 on March 13 sold on the breakout to 37.60 on March 22. We bought again on the pullback at 30.80 on March 30 and sold on the huge breakout to 36.50 the next day. In both instances, the moves appeared to be too much too quick and due for a breather, which they indeed took.

Forward Industries (FORD)
Forward Industries is another example where the top of the flag pole (see the early 2005 up-bar) is clearly illustrated. Traders who tracked the stock after its initial thrust above 8, and who waited until it confirmed the next upmove by breaking through 8 again, were well rewarded, as the stock went on to triple from there. We caught the stock as it flagged at around 15.05 on May 4 and rode it for nearly 5 points to 19.88 on May 20, when it appeared to be getting a little too far above its moving averages.

These four examples illustrate winning chart patterns. Longer-term traders could have ridden each of these up for substantial gains by merely setting stops slightly below the moving averages. Shorter-term traders could have identified, as we did, flags along the way on each of these charts to take advantage of pauses before the next up move in these orderly patterns.
Kendle International (KNDL)
An analysis of Kendle International's chart illustrates this strategy. As the daily chart indicates, Kendle in February 2005 broke out of a base pattern that extended back almost two years. Some traders, who missed entering early, may have given up on the stock when it doubled by late June, but a closer look at the chart shows why it had more room to move.
Kendle's pullbacks were orderly, coming on lower volume and holding near its moving averages, a key sign of more upside to come. Only once did its pullback break beneath the 40-day moving average (in mid-April), but on extremely low volume. Otherwise, as the daily chart indicates, each pullback hugged the 21-day moving average, or, at worst, as in early July, touched the 40-day.
The pattern was breakout (February), flag, breakout (June), flag, breakout (July), flag, breakout (August), flag and a breakout again in September, where it closed the month at $28.14, more than 3 1/2 times its price before the February breakout. Volume on each pullback was a small fraction of the level of the breakout, and a shallow decline just grazing the moving averages suggested a continuation of the uptrend.

As a stock in a rising pattern pulls back, look for several factors to portend the continuation of the pattern. First, look for very low volume on the pullback – between 10% and 25% of the average volume of the last 90 days. Second, watch for the decline to flatten near the 21- or 40-day moving average on the hourly charts in a quiet, narrow flag-type formation.
When the breakout comes, buy on the initial thrust out of this flag pattern. This means a sudden dramatic change in price accompanied by heavy volume. The price doesn't necessarily have to rise above the top of the flagpole (i.e., the previous rally high prior to the consolidation), but only needs to be a bar that is at least several times the size of the previous several bars on the chart.
Wait to add to the position until the stock takes out the top of the flagpole, which is key short-term resistance. This will protect against a head fake, which is a move that starts out dramatically but quickly fizzles price- and volume-wise after just a bar or two and has no follow-through and in particular does not make it through the top of the flag pole.
Set a stop below the bottom of the lowest level reached during formation of the consolidation or flag pattern out of which it has broken.
Kendle, after pulling back on low volume in late-March and April, flattened for a month at its moving averages just under 12. In early June it broke out through 12 towards its previous rally high near 13 and was contained there for a few days before breaking through that key resistance zone and never looking back.
We got into Kendle at that 13 level, the top of the flag pole, on June 5 and rode it up until the pullback in August at around 19. We had a set a price target near prior overhead resistance at around 20 going back to the start of 2002, and when that level contained the stock we exited, happy to take a 50% trade. We are also short-term traders, looking for quick (1-week to 1-month) round trips out of the ebbs and flows of breakouts and consolidations. Kendle went on to hold its 21-day moving average at around 18, and rally from there to nearly 29 by the end of September.
The Kendle example illustrates the potential that chart patterns such as high-volume breakouts from long bases and low-volume flags can have in predicting price appreciation.
Energy Conversion Devices (ENER)
Another strong illustration is Energy Conversion Devices. After a surge out of a nearly two-year base pattern in the fall of 2004 that doubled the share price to over 20, ENER then hit a plateau for six months before breaking out again in June of this year.
We got into the stock on June 14 at 18.28, just as it was crossing back over its 21-day moving average and its late-May rally high. Such a crossover is a bullish sign, and as mentioned takeouts of prior rally highs are good points to enter. Like with Kendle, we exited after a 50% gain, at 27.50 on August 9. The stock had only slightly broken its long-term resistance level at 27 going back to 2002, but wasn't thrusting on heavy volume and seemed due for a retracement. In fact, this was about the high for the rally, and the stock did consolidate somewhat. Our mistake was not to re-enter when it broke out above that level a couple weeks later on its way to close September at 44.46 -- and doing so while never once breaking even its 21-day moving average!

Dynamic Materials (BOOM)
Sometimes, breakouts can happen so quickly that traders need to wait for the move to exhale a bit. In the case of Dynamic Materials, the stock gapped up from the mid-3's to over 17 in November 2004. There was very little time to catch that move. However, once the stock flagged and then began to break out again in February -- and surpassed the previous rally high prior to the consolidation (i.e., the top of the flag pole) at around 16 -- the pattern was screaming, "Buy!"
We actually didn't spot BOOM until the next flag in the 30 zone, where we traded it twice for two quick 20% trades. We bought on a consolidation to a split-adjusted 31.75 on March 13 sold on the breakout to 37.60 on March 22. We bought again on the pullback at 30.80 on March 30 and sold on the huge breakout to 36.50 the next day. In both instances, the moves appeared to be too much too quick and due for a breather, which they indeed took.

Forward Industries (FORD)
Forward Industries is another example where the top of the flag pole (see the early 2005 up-bar) is clearly illustrated. Traders who tracked the stock after its initial thrust above 8, and who waited until it confirmed the next upmove by breaking through 8 again, were well rewarded, as the stock went on to triple from there. We caught the stock as it flagged at around 15.05 on May 4 and rode it for nearly 5 points to 19.88 on May 20, when it appeared to be getting a little too far above its moving averages.

These four examples illustrate winning chart patterns. Longer-term traders could have ridden each of these up for substantial gains by merely setting stops slightly below the moving averages. Shorter-term traders could have identified, as we did, flags along the way on each of these charts to take advantage of pauses before the next up move in these orderly patterns.
Last edited by a moderator:
