In this article we look at the current market correction with an eye on price and volume and observe how this has marked changes in market sentiment in the past.
The financial papers do not have a problem creating plausible stories that attempt to explain the recent market downturn. Although many fundamental factors have contributed to this recent blowout, as technicians, we take a completely different perspective. Besides looking for clues that might give us insight into the causes of this correction, we are looking for symptoms of a reliable recovery as well.
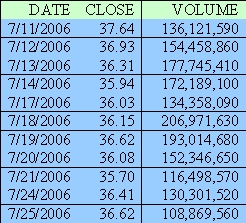
In the past 37 trading days, the cues (NASDAQ-100: QQQQ) went from an intraday trading high of $40 to a $36.62 close on 7/25/06. Most technicians will automatically inspect recent daily trading volume to substantiate direction. The current environment -falling prices along with strong volume - is usually seen as bearish, but many technicians, after a day of excessive trading activity, look upon it as the beginning of a bullish setting.
Although this may be accurate, the best way to come to a conclusion is to examine the past. By looking at the chart, we see how active trading volume has an influence on price.
In this article we investigate days in which the daily trading volume in the cues (NASDAQ-100: QQQQ) was > 150,000,000 shares. In 645 trading days (January 2, 2004 - June 25, 2006), the average daily trading volume was 97 million shares with a standard deviation of 30 million shares. And, as a volume junkie, I believe the 28 days with active trading volume (i.e., > 150,000,000 shares) provide important lessons.
Previously, only 13 out of 594 trading days were capable of reaching this lofty goal (2.6%), but in the results of the last 51 trading days, 15 days (29.4 %) were able to achieve this number.
Applying the Numbers
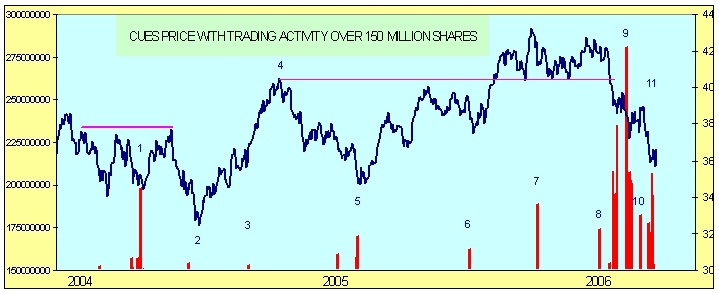
The blue line in the chart represents the price of the cues for the previous 645 trading days. The red vertical lines indicate days in which trading volume was over 150 million shares. The blue numbers are a reference for discussing the impact of excessive trading volume on future pricing.
RECENT RESULTS
Prior to this week's recent 92¢ correction, the cues were cut down by $1.94 in 9 days. Accentuating this slide were six days with volume over 150 million shares. Many experts would contribute this week's two-day rally to the July 21, 2006 slowdown in volume (119 million shares) along with a 1.05 percent loss. However, if this rally continues without an appreciable increase in volume, most technicians would not take these past two days seriously.
Looking at the Numbers
Although the results may not apply to other trading instruments, in looking at 645 days for the QQQQ's in which there was active trading volume we can make the following generalizations:
Preliminary research on the cues does show some patterns of predictability, but more analysis is necessary before putting our cash to work. Nevertheless, when there are a slew of days with excessive volume - unless you are fairly certain of trading direction - you should stand clear, or take a smaller position in the market until a more definite pattern of success or failure emerges.
The financial papers do not have a problem creating plausible stories that attempt to explain the recent market downturn. Although many fundamental factors have contributed to this recent blowout, as technicians, we take a completely different perspective. Besides looking for clues that might give us insight into the causes of this correction, we are looking for symptoms of a reliable recovery as well.
In the past 37 trading days, the cues (NASDAQ-100: QQQQ) went from an intraday trading high of $40 to a $36.62 close on 7/25/06. Most technicians will automatically inspect recent daily trading volume to substantiate direction. The current environment -falling prices along with strong volume - is usually seen as bearish, but many technicians, after a day of excessive trading activity, look upon it as the beginning of a bullish setting.
Although this may be accurate, the best way to come to a conclusion is to examine the past. By looking at the chart, we see how active trading volume has an influence on price.
In this article we investigate days in which the daily trading volume in the cues (NASDAQ-100: QQQQ) was > 150,000,000 shares. In 645 trading days (January 2, 2004 - June 25, 2006), the average daily trading volume was 97 million shares with a standard deviation of 30 million shares. And, as a volume junkie, I believe the 28 days with active trading volume (i.e., > 150,000,000 shares) provide important lessons.
Previously, only 13 out of 594 trading days were capable of reaching this lofty goal (2.6%), but in the results of the last 51 trading days, 15 days (29.4 %) were able to achieve this number.
Applying the Numbers
The blue line in the chart represents the price of the cues for the previous 645 trading days. The red vertical lines indicate days in which trading volume was over 150 million shares. The blue numbers are a reference for discussing the impact of excessive trading volume on future pricing.
- In 13 trading days, there were five days with trading activity over 150 million shares. After stumbling $2.78, a brief recovery brought prices to a triple top. Most influential was the 198 million shares, which dried out much of the selling during this temporary downward move. On the way up, the cues fell prey to resistance (---); as they were unable to rise above their previous peak; thereafter, they dropped to their lowest closing price ($32.47).
- On July 28, 2004 the cues broke out of a long dry spell with a day of strong trading. The 154 million shares came during the final days of a sharp downturn, but on this day, the cues finally broke below $35.00. It took eight more trading days before they reached their lowest price and then returned to their winning ways.
- This 91¢ advance with strong volume, came after a slight downturn, which is often a bullish sign. More importantly this day was instrumental as the cues finally broke past resistance.
- The cues were able to trade 29 consecutive days with a closing price above $39.00, but the average volume was a paltry 81 million shares per day. And, with little buying pressure the cues began a long slide downward.
- Two consecutive days over 150 million shares may have set the stage for the beginnings of a long rally. The two-day loss was noticeably painful ($1.32) - closing at $34.74. Nevertheless, three days later they fell to their lowest close ($34.70) for 2005.
- This day broke a streak of 121 trading days without confronting strong volume. After a slight downturn, a 51¢ loss with 162 million shares may have been responsible for lifting the cues above $42.
- The start of stormy skies as the cues fell $1.27 on 189 million shares to a price of $42.26. Before this day there were 119 consecutive days in which the closing price was above $40, 12 days later they closed below this level.
- A series of red vertical spikes, provides further reinforcement for the sharp pullback, the cues fall below $40 on daily volume over 150 million shares in all but four of the next 9 trading days. Despite this flurry of activity, the cues fail to stay over $40.
- An extremely active day - 281 million shares with a 25¢ advance, but the $1.07 intraday range kept everyone busy. On many occasions extreme volume is responsible for igniting a rally; but, apparently, in this instance, people became more cautious.
- After three straight days over 200 million shares with prices advancing $1.25, the next nine trading days were less active, and prices stayed within a closing range of $1.53.
- On June 29, 2006, the cues were able to finish the regular session at their highest price ($38.96) with 186 million shares. It was the last remarkable positive day (advancing $1.00 in the regular trading session). Thereafter, sellers took control, as this day ushered in seven days in which the average daily volume was 88 million shares.
- The cues began this nasty correction on April 27, 2006, falling from $42.26 to $35.70; with seven days surpassing 200 million - clearly, something was amiss! In the last eight trading days, six were over the 150 level causing the cues to slide $1.26. In comparison to the opening price of 2004 ($36.66), the cues fell 96 cents to $35.70 on July 21, 2006.
RECENT RESULTS
Prior to this week's recent 92¢ correction, the cues were cut down by $1.94 in 9 days. Accentuating this slide were six days with volume over 150 million shares. Many experts would contribute this week's two-day rally to the July 21, 2006 slowdown in volume (119 million shares) along with a 1.05 percent loss. However, if this rally continues without an appreciable increase in volume, most technicians would not take these past two days seriously.
Looking at the Numbers
Although the results may not apply to other trading instruments, in looking at 645 days for the QQQQ's in which there was active trading volume we can make the following generalizations:
- Without active trading volume it was difficult to break resistance (triple-top).
- Without active trading volume it was difficult for the cues to sustain a $40 price.
- The cues were incapable of sustaining high prices ($40) without active trading volume (> 150 million shares).
- A strong loss with excessive volume was often the catalyst behind an impressive rally, but the impact was not always immediate.
- The longer the span of days without active volume, the more likely that the price of the cues would sustain its current movement.
- Consecutive trading days with excessive volume (swarms of vertical red lines) generally provide a forceful continuation of current pricing patterns.
- Although it is not always immediate, a day with 150 million shares often influences direction. It can either sustain current direction or, in some cases, be instrumental in reversing the direction of the cues.
Preliminary research on the cues does show some patterns of predictability, but more analysis is necessary before putting our cash to work. Nevertheless, when there are a slew of days with excessive volume - unless you are fairly certain of trading direction - you should stand clear, or take a smaller position in the market until a more definite pattern of success or failure emerges.
Last edited by a moderator: