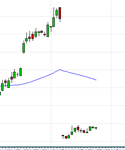
this is kinda scary.
what does it mean?
should i avoid charts like thsi?
does it mean millions of sellers sold so much over that day or two, the price just dropped so rapidly?
the day of the 13p share shows millions more trades/volumes being done,compared to the 78p days. So this clearly says sellers were dominant in the market, right?
thanks.

