Walid Salah Eldin's Market Analysis

God willing, it looks in the case of retreating further there can be supporting level at 1.4450 first, before 1.4324 which can be followed by 1.4226, while the resistance is still existing at 1.4666 which dragged the cable down last Thursday.

Have a good day and take care
 
Gbpusd

The GBPUSD may try to reach the 1.4700 level. For now the 1.4400 level may act as support.
 
Jan US Labor report gave the Greenback short-lived rebound only

Jan US Labor report could give the Greenback short-lived rebound but it could not change the current market sentiment which is still dominated by the Chinese economic slowdown and financial turmoil which hit the markets this year with retreating of the oil prices.
After its meeting on Jan. 27, FOMC said that it is assessing currently the global economic slowdown and the financial development implications for the labor market, the inflation, and for the balance of risks to the outlook.
But Fed's vice president Stanley Fischer came last week to dampen the interest rate outlook saying that the Fed's next step is still unclear, as it is too difficult to gauge the impact on the U.S. economy from recent turmoil in financial markets and uncertainty over China.
It looks to the markets meanwhile that this waiting and see stance of the Fed can be prolonged behind the first quarter of this year which is watching harsh winter like what has happened in 2014 and 2015 and caused GDP annual contraction.
The US economy could get over the bad winter in the last 2 year but this time it is looking harder, after actual GDP declaration in US led it to grow by only 0.7% in Q4, after growth by 2% following expansion by 3.9% in the second quarter of last year.
The gold was one of the most gainers from this sentiment to easily resume its rising surpassing $1163 which stopped it last Friday to cause forming only a new higher low at $1145.30 following the release of US Jan labor report which came mixed showing lower unemployment rate at 4.9% but with adding of only 151k of jobs out of the farming sector, while the market was waiting for 195k.
After holding above 1.11, EURUSD could also resume its rising to be traded now near 1.1170 just above its hourly SMA50, after rising above its hourly SMA20.
EURUSD could gain momentum last week to get over its daily SMA100 and its daily SMA 200, after having clear breaking of its trendline resistance which is extended from 1.3992 to 1.1712.
Despite setting back to 1.1108, EURUSD daily Stochastic Oscillator (5, 3, 3) which is more sensitive to the volatility could keep existence in its overbought region above 80 by its main line which is reading now 84.533 and also its signal line which is reading now 86.127.
EURUSD could make today rebound, despite EU Feb Sentix Investor Confidence retreating to 6, while the consensus was referring to easing back to 7.6 only from 9.6 in January.

Have a good day

Kind Regards
Walid Salah El Din
Global Market Strategist of FX-Recommends
 

Attachments

  • XAUUSD Daily 08-02-2016 12-05-25 م.jpg
    XAUUSD Daily 08-02-2016 12-05-25 م.jpg
    209.1 KB · Views: 158
  • EURUSD Daily 08-02-2016 11-25-53 ص.jpg
    EURUSD Daily 08-02-2016 11-25-53 ص.jpg
    270.9 KB · Views: 179
Last edited:
The Gold ascending upside momentum drove it to be near $1200

Jan US Labor report could give the Greenback short-lived rebound across the broad but it could not change the current market sentiment which is still dominated by the Chinese economic slowdown and financial turmoil which hit the markets this year with retreating of the oil prices.
After its meeting on Jan. 27, FOMC said that it is assessing currently the global economic slowdown and the financial development implications for the labor market, the inflation, and for the balance of risks to the outlook.
But Fed's vice president Stanley Fischer came last week to dampen the interest rate outlook saying that the Fed's next step is still unclear, as it is too difficult to gauge the impact on the U.S. economy from recent turmoil in financial markets and uncertainty over China.
It looks to the markets meanwhile that this waiting and see stance of the Fed can be prolonged behind the first quarter of this year which is watching harsh winter like what has happened in 2014 and 2015 and caused GDP annual contraction.
The US economy could get over the bad winter in the last 2 year but this time it is looking harder, after actual GDP declaration in US led it to grow by only 0.7% in Q4, after growth by 2% following expansion by 3.9% in the second quarter of last year.
The gold was one of the most gainers from this sentiment to easily resume its rising surpassing $1163 which stopped it last Friday to cause forming only a new higher low at $1145.30 following the release of US Jan labor report which came mixed showing lower unemployment rate at 4.9% but with adding of only 151k of jobs out of the farming sector, while the market was waiting for 195k.
The gold could have another positive sign by containing its full falling from $1191.58 to $1046.08.
The Gold has reached this high upside momentum by getting over its daily SMA200 with crossing $1130 last week.
The Gold has started gathering momentum by surpassing its daily SMA100 which came accompanied with breaking its previous resistance at $1112 which capped it on last Nov. 4.
$1071 could also help the gold previously to bounce up again above its daily SMA50 forming a floor above $1058 which drove the gold to start being above its daily Parabolic SAR (step 0.02, maximum 0.2) for 26 consecutive days reading today $1134.45.
XAUUSD daily RSI-14 is referring now to existence in its overbought region above 70 reading now 80.409 and also its daily Stochastic Oscillator (5, 3, 3) which is more sensitive to the volatility is having now its main line in its overbought area above 80 reading 94.270 and also its signal line which is reading now 94.371.
Important levels: Daily SMA50 @ $1090.21, Daily SMA100 @ $1108.44 and Daily SMA200 @ $1130.49
S&R:
S1: $1145.30
S2: $1108.26
S3: $1071.22
R1: $1205.63
R2: $1232.30
R3: $1245.90

Have a good day

Kind Regards
Walid Salah El Din
Global Market Strategist of FX-Recommends
 

Attachments

  • XAUUSD Daily 08-02-2016 07-31-59 م.jpg
    XAUUSD Daily 08-02-2016 07-31-59 م.jpg
    225.9 KB · Views: 169
JPY is still boosted, before the Chinese holidays ending

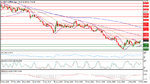
The lower interest rate outlook in US is still dominating the current market sentiment weighing down on the greenback boosting demand for the gold amid worries about the global economic performance.

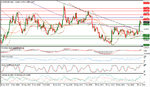
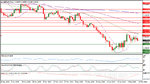
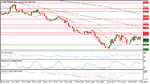
After forming lower highs, The oil benchmarks turned down again to test Jan. 20 lows with continued economic deceleration signs in china and US dragging the demand expectations down further.

IEA could spur the declining this time by saying that the demand for OPEC production will fall this year by about 0.1m barrels a day to 31.7m barrels, while the organization which accounts for about 35% of the global production is producing currently what's close but below 33m barrels a day.

So, it is not worry about oversupplied oil markets because of Iran only but also lower demand because of the economic slowdown.

Brent could barely hold above $30 per barrel but it dived well below its daily SMA20 again, after failing to have a place again above its daily SMA50.

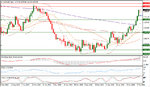
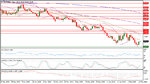
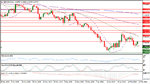
USDJPY which rose to form a lower peak at 121.67 by BOJ's decision to apply negative interest rate is now trading close to 114.50 undermined by increasing demand for safe assets with intensifying selling in the equities markets.

As the risk-off sentiment usually boosts demand for the Japanese yen which has the lowest cost financing burden among the major currency with JGB 10YR bond yield well below zero currently.

The Japanese yen has been exposed to verbal intervention from the Japanese Vice Finance Minister for International Affairs Asakawa and the Fin Min Aso, after this recent excessive movement of the Japanese yen, despite BOJ's action which could support Nikkei 225, before resuming its retreating which drove it below 15700 today.

From another side, it seems that Trump's gains in the presidential race spurs demand for safe haven because of his aggressive talking which is looking most of time undiplomatic.

While USDJPY can be exposed to further falling with the Chinese markets returning from holidays, as The Japanese yen can gain benefits from the Chinese Yuan suffering, as an Asian competitive reserve currency.

USDJPY depreciation reached 114.16 until now and the way down can be met by Nov. 10, 2014 low at 113.84, while the way down below it is looking slippery with no seen supporting bottom on the daily charts, before 110 psychological level.

USDJPY has been exposed to more stop buying orders, after breaking 115.55 which has been the low of Dec. 16, 2014 to open this new range of trading.

Jan US Labor report could give USDJPY chance to form only an intermediate resistance at 117.51 through this falling because of the current bearish market sentiment.

USDJPY daily RSI barely into the oversold area below 30 reading 29.865 and also its daily Stochastic Oscillator (5, 3, 3) which is more sensitive to the volatility is having its main line in the oversold area below 20 reading now 12.205 and also its signal line which is reading now 11.176.

USDJPY Daily MACD (12, 26, 9) which is less sensitive to the volatility is having its main line well below the zero line at -0.9368 and also its signal line which has been in the negative region since last Dec. 11 is referring today to -0.3705 to reflect the accumulating downside pressure.

USDJPY daily Parabolic SAR (step 0.02, maximum 0.2) is in relatively high place above the trading rate, after this massive falling to read today 119.96 in its sixth day of being above the trading rate.

Important levels: Daily SMA50 @ 119.47, Daily SMA100 @ 120.36 and Daily SMA200 @ 121.38 which are existing also in relatively high places after ending side way of trading above 115.55

S&R:

S1: 114.16
S2: 113.84
S3: 110
R1: 117.51
R2: 120
R3: 121.67

Have a good day

Kind Regards
Walid Salah El Din
Global Market Strategist of FX-Recommends
 

Attachments

  • USDJPY Daily 10-02-2016 06-37-34 ص.jpg
    USDJPY Daily 10-02-2016 06-37-34 ص.jpg
    206.8 KB · Views: 174
Last edited:
The equities are still taking their clues from the oil benchmarks

The gold came under pressure in the beginning hours of the week to be traded below $1220 again, as the risk apatite could return to the markets making Shanghai composite loss after long vacation nearly 50 points only sending Nikkei 225 up more than 800 points, Despite the preliminary release of Q4 GDP of Japan which has shown quarterly contraction by 0.4% and yearly contraction by 1.4%.
The investors could find reason to reload risky assets by oil benchmarks rebound by the end of last week but the fear of forming lower highs is still existing with looming economic downside risks.
After overextended wave of selling dragged WTI down to $26.10, it could bounce up to be traded near $29.30 by the end of last week driving Dow Jones industrial average to gain back more than 300 points before long holiday.
William Dudley who is the Fed’s governor of New York has tried during the last session of last week to lower the worries about the US economy saying that it is now more resilient to any shocks, after the Fed's Chief Yellen had indicated in her testimonies before the congress financial committee and the senate banking committee that there are many dovish economic developments have happened, after the Fed raised its funds rate for the first time since 2006 by 0.25% on last Dec. 16 but she has not yet ruled out raising the interest rate again this year.
anyway the dovish interest rate outlook in US became well-materialized in both secondary and prime money markets in US.
While the gold is still able to get use of this outlook to gain back higher places, as the economic exacerbation came campaigned with lower interest rate outlook in US dampening the demand for the greenback.
While the inflation outlook is still sized by lower global economic expansion and lower oil prices making the Fed in no need to be in rush to raise the interest rate for containing inflation upside risks, while the US economy is looking in need to its accommodative stance at this level, after GDP annualized deceleration in the recent 3 quarters and manufacturing contraction in the recent 3 months.
Technically, CL Mar. 16 has become more bearish by having lower low at $26.05 below its previous low of last Jan. 20 at $27.55 containing its rebound from it to $34.81.
As last rebound could improve its look over the short term as it can expose it to another impulsive wave to the down side.
CL Mar. 16 is still well below its Daily SMA20 and it is still also below its daily Parabolic SAR (step 0.02, maximum 0.2) for the ninth consecutive day reading today $32.53
But it could have the main line of its daily Stochastic Oscillator (5, 3, 3) which is sensitive to the volatility in the neutral region coming up from the oversold area below 20 reading now 45.135 and also its signal line which is reading 26.042.

Important levels: Daily SMA20 @ $30.36, Daily SMA50 @ $33.59, Daily SMA100 @ $36.13 and Daily SMA200 @ $45.46.
S&R:
S1: $26.05
S2: $25.00
S3: $23.51
R1: $33.64
R2: $34.81
R3: $35.57

Have a good day

Kind Regards
Walid Salah El Din
Global Market Strategist of FX-Recommends
 

Attachments

  • CL Mar. 16 Daily 15-02-2016 05-57-42 ص.jpg
    CL Mar. 16 Daily 15-02-2016 05-57-42 ص.jpg
    201.3 KB · Views: 217
The oil extended rebound drove the risk appetite higher

The bullish market sentiment could persist for another day driving the major equities future indexes of US higher with absence of the US markets because of the presidency day.
After forming double bottom at 1804, SP-MAR16 could bounce up to surpass 1877.50 which stopped it last Wednesday to be traded now close to 1890.
While WTI could extend its rebound, after forming a bottom at $26.05 last Thursday to find CL Mar. 16 trading above $30 right now ahead of Saudi and Russian Oil Ministers talks today in Doha.
This improving of the risk appetite could place the gold again below $1200 psychological level, after reaching $1263 per ounce, while the demand for loading risky assets drove USDJPY up to be traded near 114.80, after finding a bottom last Thursday at 110.96.
USD could be boosted across the broad dragging EURUSD down to be traded now near 1.1150, after the ECB president Draghi highlighted yesterday the banking system resilience against shocks after the credit crisis in his speech to the European Parliament
Following the last ECB meeting on last Jan . 21, Draghi hinted that "The ECB may reconsider its policy stance in March amid a deteriorating economic outlook and turmoil in global markets".
He said yesterday too that the ECB could employ next meeting on Mar. 10 a variety of instruments, if the policy makers have seen that more stimulus measures are needed for stimulating the economy which has grown by 0.3% quarterly in the last quarter and the third quarter of last year and also for raising the inflation which has been up by only 0.4% yearly in January, while the ECB's target is below but close to 2%.
God willing the main focusing in the Forex market today will be on the release of US inflation figures over the producing level and the consuming level.
UK CPI is expected to show rising in January by 0.3% yearly, after increasing by 0.25 in December was the highest last year because of the global economic slowdown and the energy prices slide.
The cable is now standing below its daily SMA50, after facing resistance at 1.4666 halted its rebound from 1.4078.
After dipping down to 1.4349 on Feb. 8, The cable returned to be traded below its daily Parabolic SAR (step 0.02, maximum 0.2) which is reading today 1.4630 in its seventh day in a row of being above the trading rate.
The cable daily RSI-14 is now in the neutral territory reading 47.163 and also its daily Stochastic Oscillator (5, 3, 3) which is more sensitive to the volatility is having now its main line in the neutral area reading 41.976 with its signal line which is reading now 49.888 to show balanced situation meanwhile.

Important levels: Daily SMA50 @ 1.4614, Daily SMA100 @ 1.4928 and Daily SMA200 @ 1.5223
S&R:
S1: 1.4324
S2: 1.4147
S3: 1.4078
R1: 1.4666
R2: 1.4723
R3: 1.4845

Have a good day

Kind Regards
Walid Salah El Din
Global Market Strategist of FX-Recommends
 

Attachments

  • GBPUSD Daily 16-02-2016 06-56-59 ص.jpg
    GBPUSD Daily 16-02-2016 06-56-59 ص.jpg
    204.3 KB · Views: 164
The cable came under pressure, after the release of Jan UK inflation data

UK inflation data of January which came out today have shown housing prices rising by a slower pace than expected, as DCLG House Price Index rose by only 6.75 yearly and the consensus was referring to rising by 7.9% after increasing in December by 7.7%.
The input prices and the output prices came to show lower than expected monthly decreasing over the producing level, while UK CPI come as expected showing yearly rising by 0.3% which is the highest pace of rising since Jan 2015 but the core figure excluding food and energy surged by only 1.2% and the market was waiting for rising by 1.3% after increasing by 1.4% in December.
The cable rose to 1.4514 but it retreated again to be traded near 1.4450, after these data.
The cable is still standing below its daily SMA50, after facing resistance at 1.4666 halted its rebound from 1.4078.
After dipping down to 1.4349 on Feb. 8, The cable returned to be traded below its daily Parabolic SAR (step 0.02, maximum 0.2) which is reading today 1.4630 in its seventh day in a row of being above the trading rate.
The cable daily RSI-14 is now in the neutral territory reading 48.094 and also its daily Stochastic Oscillator (5, 3, 3) which is more sensitive to the volatility is having now its main line in the neutral area reading 44.480 with its signal line which is reading now 50.722 to show balanced situation meanwhile.

Important levels: Daily SMA50 @ 1.4614, Daily SMA100 @ 1.4928 and Daily SMA200 @ 1.5223
S&R:
S1: 1.4324
S2: 1.4147
S3: 1.4078
R1: 1.4666
R2: 1.4723
R3: 1.4845

Have a good day

Kind Regards
Walid Salah El Din
Global Market Strategist of FX-Recommends
 

Attachments

  • GBPUSD H1 16-02-2016 01-15-38 م.jpg
    GBPUSD H1 16-02-2016 01-15-38 م.jpg
    188.1 KB · Views: 216
  • GBPUSD Daily 16-02-2016 01-16-15 م.jpg
    GBPUSD Daily 16-02-2016 01-16-15 م.jpg
    236.2 KB · Views: 169
Gbpusd

The GBPUSD has broken an important trendline, but it has found some support at the 1.4300 level.


gbpusd-d1-activtrades-plc.png
 
The GBPUSD has broken an important trendline, but it has found some support at the 1.4300 level.


gbpusd-d1-activtrades-plc.png

Rising up further is in need now for more reasons to be materialized, after yesterday relatively fast slide which is in need to be contained first before asking for longing this pair.
it is mainly depressed now by lower high at 1.46666
 
Gbpusd

The GBPUSD breaks below the 1.4300, but it did no touch the 1.4200. Bearish trend is still in place.
 
GBP higher uncertainty higher volatility new era

London Mayor Boris Johnson who is expected to succeed David Cameron by 2020 elections announced his decision during the weekend to go along with UK Justice Secretary Michael Gove for campaigning against Cameron's deal preferring Brexit.
The conservative ruling party seems ahead of critical times, despite David Cameron's efforts which ended last Friday to a deal to have special British characteristic in EU freeing the union membership from most of the contents the other EU countries follow to keep UK in EU but that's looking not enough even for the ruling party itself!
So, what about the labor opposing party?
It looks that there can be political instability next in UK with more surprises ahead till the referendum date which will be waited to end this uncertainty.
God willing, The cable main figure this week is UK Q4 GDP which is expected to come as the same as the preliminary reading showing quarterly growth by 0.5%, after expansion by 0.4% in the third quarter of last year.
The cable opened the new week trading at 1.4276, after touching its hourly SMA200 by reaching 1.4407 by the end of last week supported by the agreement which opened the way to Cameron to date The Brexit referendum next Jun. 23.
The cable retreated further during the Asian session, after failing to restore a place above 1.43 again.
The cable which shrugged off Jan retail sales yearly rising by 5.2% is still well below its daily Parabolic SAR (step 0.02, maximum 0.2) which is reading today 1.4551 in its eleventh day in a row of being above the trading rate.
The cable daily RSI-14 is now in the neutral territory reading 41.192 and also its daily Stochastic Oscillator (5, 3, 3) which is more sensitive to the volatility is having now its main line in the neutral area reading 33.781 with its signal line which is closer to the oversold area below 20 reading now 28.986.
The cable has been already capped below its daily SMA50 by facing resistance at 1.4666 halted its rebound from 1.4078 to be followed by lower high at 1.4578, before last Friday peak at 1.4407.

Important levels: Daily SMA50 @ 1.4546, Daily SMA100 @ 1.4894 and Daily SMA200 @ 1.5194
S&R:
S1: 1.4233
S2: 1.4147
S3: 1.4078
R1: 1.4407
R2: 1.4576
R3: 1.4666

Have a good day

Kind Regards
Walid Salah El Din
Global Market Strategist of FX-Recommends
 

Attachments

  • GBPUSD Daily 22-02-2016 02-04-02 ص.jpg
    GBPUSD Daily 22-02-2016 02-04-02 ص.jpg
    209.3 KB · Views: 291
Last edited:
Gbpusd

The GBPUSD has found support at the 1.4000 zone, the brearish trend is still in place and the price may try to break below that level. The 1.42 or 1.43 may act as resistance.
 
The oil prices slide pushes the risk appetite down

With the oil prices slide again, The investors could easily shrug off the improving of the US housing market which has been highlighted yesterday by the release of Jan US Existing Home Sales which have shown yearly rising by 5.47m, while the market was waiting for 5.32m, after 5.45m in December.
The US equities have been tempered also by Feb US consumer confidence falling to 92, while the consensus was referring to 97, after 97.8 in January.
While gold could get use of this dovish market sentiment which persisted during today Asian session to rise for trading again near $1230 with US treasuries yields retreating, as the demand for safe haven could boost their prices.
The oil prices have been negatively impacted by Saudi Oil Minister Ali Al-Naimi reaffirmed on only freezing the oil production at January levels according to the reached deal with Russia, Qatar and Venezuela on Feb. 16 for solving the oil prices slide crisis.
From the other side, Iran’s oil minister Bijan Namdar Zanganeh said that It’s “ridiculous” for Saudi Arabia to propose that other nations will freeze production, after the kingdom has already increased its output to be more than 10m barrels a day, while Iran is planning to raise its daily production by one million in the coming months, after lifting the sanctions on it.
It looks that there can be no breakthrough of this crisis with no Iranian Saudi deal because of the existing tension between these 2 countries.

Brent Apr. 16 contained last Monday white day by a dark day yesterday brought it down to be traded below $33.
Brent Apr. 16 is now trading below its daily SMA20 and daily SMA50 again, after forming lower high at $35.75 below last Jan. 28 high at $36.75 which has been the highest reached level, after forming a bottom at 27.10 on last Jan. 20.
Brent Apr. 16 daily RSI (14) is now in the neutral region reading 48.401 and also its daily Stochastic Oscillator (5, 3, 3) which is more sensitive to the volatility is still having its main line in neutral area reading 44.330 and leading to the downside its signal line which is in a higher place in the neutral region reading now 55.506.
Brent Apr. 16 is waiting today for the release of US EIA Oil stockpile of the week ending on Feb. 19 to be up by 3.165m, after rising a week earlier by 2.147m to 504,105m

Important levels: Daily SMA20 @ $33.51, Daily SMA50 @ $33.90, Daily SMA100 @ $40.29 and Daily SMA200 @ $47.84
S&R:
S1: $31.80
S2: $29.87
S3: $27.10
R1: $35.75
R2: $36.75
R3: $39.68

Have a good day

Kind Regards
Walid Salah El Din
Global Market Strategist of FX-Recommends
 

Attachments

  • Brent Apr. 16 Daily 24-02-2016 01-32-20 ص.jpg
    Brent Apr. 16 Daily 24-02-2016 01-32-20 ص.jpg
    199.4 KB · Views: 392
The GBPUSD has found support at the 1.4000 zone, the brearish trend is still in place and the price may try to break below that level. The 1.42 or 1.43 may act as resistance.

The most important thing is as i have told you previously to wait for reason to trade, as you could see what has happened between Cameron and EU and what came next from London Mayor.
The cable destiny is in these hands currently more than before and this stance can continue till the referendum.

Take Care
 
The pair will probably continue falling towards the next support at 1.3650 for now, the trend is very bearish.
 
The oil prices are still moving the market sentiment

The greenback could be boosted by US Q4 upward revision to 1% growth annually from only 0.7% preliminary reading, after growth by 2% in Q3 following expansion by 3.9% in the second quarter of last year.
The economic expansion deceleration to 1% in Q4 of last year could only lower the worries about the US economy but it cannot eliminate the fear of watching economic shrinking in the first quarter of this year which is depressed by harsh winter again could previously cause contraction in the first quarter of 2014 and 2015.
The comments which came out from the Fed's officials are all referring to adopting waiting and see stance for assessing the global economic slowdown and the financial development implications on the US economy.
While the inflation outlook in US is still sized by lower global economic expansion and lower oil prices preventing the Fed to be in rush for raising the interest rate to contain inflation upside risks.
In the same time, the US economy is still looking in need to the current Fed's accommodative stance at this level, after GDP annualized deceleration in the recent 3 quarters and manufacturing performance contraction in the recent 3 months because of the rising odds of raising the interest rate which supported the greenback from another side.
While the downside risks are mounting this quarter by continued economic deceleration in China and higher concerns about the financial situation of the banking sector amid the lower commodities and energy prices which caused depression in the mining sector.
Baker Hughes weekly report came by the end of last week to say that US Oil Rigs have fallen to only 400 which are less than third the working rigs number a year ago.
The report could tackle the oil prices progress by the end of last week weighing down on the risk appetite, as it could highlight the current lower need for digging for oil.

Last Friday Brent Apr. 16 could surpass its previous resistance at $36.75 which capped its rebound on last Jan. 28 but it came under pressure, after reaching $36.98 to go down for trading near $35.40 in the beginning hours of this new week.
Brent Apr. 16 daily RSI (14) is still in the neutral region reading 55.083 and also its daily Stochastic Oscillator (5, 3, 3) which is more sensitive to the volatility is still having its main line in neutral area reading 67.222 and also its signal line which is reading now 62.793.
Brent Apr. 16 daily MACD (12, 26, 9) which is less sensitive to the volatility could have its main line above the zero line at 0.324, while its signal line is still in the negative region reading -0.016 now.
Brent Apr. 16 daily Parabolic SAR (step 0.02, maximum 0.2) is reading now $30.84 in its eighth day of being below the trading rate which is still above its daily SMA20 and daily SMA50.

Important levels: Daily SMA20 @ $33.56, Daily SMA50 @ $33.68, Daily SMA100 @ $39.63 and Daily SMA200 @ $47.24
S&R:
S1: $31.80
S2: $29.87
S3: $27.10
R1: $36.98
R2: $39.68
R3: $41.56

Have a good day

Kind Regards
Walid Salah El Din
Global Market Strategist of FX-Recommends
 

Attachments

  • Brent Apr. 16 Daily 29-02-2016 03-27-29 ص.jpg
    Brent Apr. 16 Daily 29-02-2016 03-27-29 ص.jpg
    228.6 KB · Views: 189
Gbpusd

The GBPUSD made a low around the 1.3833 level, from there the pair has pulled back to the upside, but the 1.4000 has proven to be a good resistance. A bearish continuation is possible.
 
The GBPUSD made a low around the 1.3833 level, from there the pair has pulled back to the upside, but the 1.4000 has proven to be a good resistance. A bearish continuation is possible.

It's just a reaction to broaden the angel and fix the oversold stance.
Have a good day
Take Care
 
Top