You are using an out of date browser. It may not display this or other websites correctly.
You should upgrade or use an alternative browser.
You should upgrade or use an alternative browser.
To All Our Bear Readers
Whilst not wanting to add to your anguish, if you are short the ftse I would imagine that you are shaking in your skins
Close today at 4906 and whilst there may be a pull back what is there to stop it going to 5000.
Perhaps our esteemed barjon will post one of his delightful charts complete with conventional s/r and the 'rice grower candle s/r'
I have no doubt that he will gently chide the 'beary boys'.
Regards
bracke
barjon
Legendary member
- Messages
- 10,752
- Likes
- 1,863
Ooooh! Nice to come home to - and we won the golf match 😀
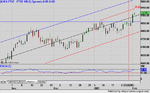
Highest daily rise for months on strong but not climactic type volume (volume experts may have a view here 😕 ) and if it means business it shouldn't pullback beyond 4882 or so assuming it doesn't just keep on going. Doesn't seem anything to hold it before it gets to that 2002 congestion range (5000 - 5400) but musn't get carried away - just watch and trade what we see.
From bracke: I have no doubt that he will gently chide the 'beary boys'
Moi? As if 😆
good trading
jon
Attachments
barjon said:Ooooh! Nice to come home to - and we won the golf match 😀
Highest daily rise for months on strong but not climactic type volume (volume experts may have a view here 😕 ) and if it means business it shouldn't pullback beyond 4882 or so assuming it doesn't just keep on going. Doesn't seem anything to hold it before it gets to that 2002 congestion range (5000 - 5400) but musn't get carried away - just watch and trade what we see.
From bracke: I have no doubt that he will gently chide the 'beary boys'
Moi? As if 😆
good trading
jon
As you well know I am not a volume expert......... I see myself more as an intermediate. No laughing please.
But for what its worth my thoughts on the volume you refer to are:
1 Large price rise on moderate volume suggests that most of the volume was buys.
therefore buying pressure continues.
2 Large price rise on moderate volume - No buying climax and subsequent sell off, just good
steady buying.
We really need some of you bears to come out of your caves and growl a reason to barjon why the beckoning land of 5000-5400 will not be reached, or have you gone back into hibernation as a result of depleted resources.
Regards
bracke
peterpr
Established member
- Messages
- 609
- Likes
- 7
bracke said:We really need some of you bears to come out of your caves and growl a reason to barjon why the beckoning land of 5000-5400 will not be reached, or have you gone back into hibernation as a result of depleted resources.
bracke
I guess that means me (among others) 🙂
Well now. I still don't see a compelling reason to be INVESTED in UK equities for the medium/long haul. BUT - that's not to say there might not be a fair amount of upside left in ftse yet (as suggested in my last post) - and it syas nothing about my day/swing view.
I still have a very bearish view of 2005. Like Jon, I did quite well out of that last jump up but I'm neutral again right now. All my indicators are on the plus side of overbought and the futures are saying we will have a down day tomorrow - could change following the FOMC announcement later of course, but I will wait and see.
Agreed, no obvious resitance before the 2002 5000ish congestion area, but both fundamentals and events in the US could easily intervene. Attached chart shows 2 std dev channel from August. There was another peek above the top boundary back in October so momentum is slowing. If that is to continue, then we should see a 60-100 ish point down move from 4930 max. However, until there is a decisive break below 4800ish, the uptrend from August remains intact.
Attachments
peterpr
Established member
- Messages
- 609
- Likes
- 7
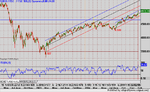
Been playing with regression analyses of ftse again.
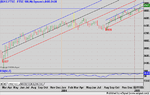
Attached chart shows 2 sets of 2x std dev channels of equal slope (ie approximately equal rate of change of price). The first from the March 2003 low to 5th March 04. The second from 13th August 04 low to last Friday. Respectively 92.7 & 92.0% of price action inside the channels so pretty impressive correlations, and separated by about 4 months of essentially rangebound action. About 50% more volatility in the first but otherwise some interesting visual parallels. (yellow bars mark the end of the respective channel data-sets)
It's clear that, on pretty well any measure of price action, we remain is a robust uptrend which won't change until the bottom boundary is convicingly breached. But there are warning signs. Sustained uptrends of this momentum are pretty rare (only 2 or 3 in the data I have back to 1997 and they are either reactions to dramatic declines - ie 9/11, or the run-up to a major top - ie 2000. On that basis it seems unlikely that we will see prices significantly above the present channel resistance on anything other than a very long term view. If the trend continues per the first one, then that argues for a median price of about 5300 by about August - but it's a BIG if.
My own view is that we'll see a break of the trend well before then and, for all the usual perma-bear reasons + historical TA ones, an upward break (ie increased momentum) is unlikely.
Next week? May bounce back off the upper channel boundary at about 5000. More likely an earlier retrace to somewhere below 4875 - possibly the lower boundary at about 4800 before having another crack at 5000.
Attachments
peterpr
I note from your post that you have become somewhat deviant, is that as a result of the fall you took a few months ago ?
I did notice that following my appeal to the bears among our readers that you were the only one to respond. Although not so much with a good growl more of a moogrowl, not starting to grow horns are you !
With regard to your new found deviancy, I appreciate what is being shown but does it assist any further than simply drawing the usual supply and demand lines and thus forming the usual channel ?
When the ftse falls with a thud the bears will rush out of their caves and growl that they told us so and in the same way when the ftse soars the bulls will charge out of their pens and say they told us so. Both of them will neglected to reminder us that they had had been doing so for a considerable period and had got it wrong. Sooner or later both are going to get it right but it is not by accurate analysis but by their turn coming round.
None of the above should be taken as criticism, merely as comment.
Regards ( deviatingly )
bracke
Last edited:
barjon
Legendary member
- Messages
- 10,752
- Likes
- 1,863
bracke When the ftse falls with a thud the bears will rush out of their caves and growl that they told us so and in the same way when the ftse soars the bulls will charge out of their pens and say they told us so. Both of them will neglected to reminder us that they had had been doing so for a considerable period and had got it wrong. Sooner or later both are going to get it right but it is not by accurate analysis but by their turn coming round. bracke[/QUOTE said:hey brackey boy - whats all this about WHEN the ftse soars? Isn't a steady rise from below 3400 good enough for you 😆 And just when have those charging bulls got it wrong for the considerable period that they have been singing the bull song 😕
good trading
jon
peterpr
Established member
- Messages
- 609
- Likes
- 7
bracke said:peterpr
I note from your post that you have become somewhat deviant, is that as a result of the fall you took a few months ago ?
bracke
Chuckle, chuckle.
Seriously though its facinating stuff on ftse just now.
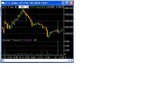
Attached daily chart shows both regression channels of last post + RSI calculated on a daily high basis. At 79.67 it's the highest its ever been on my data going back to 1997. Next highest 7th Oct last year - only about 5 others above 75 all the way back to 1997.
So. Is it going to hit 5000 this week without a retrace to bring that RSI down from present black-swan/statistical outlier levels?
Attachments
barjon said:bracke When the ftse falls with a thud the bears will rush out of their caves and growl that they told us so and in the same way when the ftse soars the bulls will charge out of their pens and say they told us so. Both of them will neglected to reminder us that they had had been doing so for a considerable period and had got it wrong. Sooner or later both are going to get it right but it is not by accurate analysis but by their turn coming round. bracke[/QUOTE said:hey brackey boy - whats all this about WHEN the ftse soars? Isn't a steady rise from below 3400 good enough for you 😆 And just when have those charging bulls got it wrong for the considerable period that they have been singing the bull song 😕
good trading
jon
No need for confusion barjon, I was commenting fron an historical perspective.
I agree that the ftse is in a bull run and yes they have got it right for the period that the ftse has been rising.
During the dot com boom the perma bulls were seeing no end to the upward rise and in the same way after the dot com crash the perma bears were seeing virtually no end to the fall.
The point I was trying to make was that being 'perma' one way or the other is not a good idea and that if the permas call it one way or the other they will eventually get it right but will 'forget' that the market moved a long way from them before it turned.
Regards
bracke
peterpr
Established member
- Messages
- 609
- Likes
- 7
bracke said:peterpr
With regard to your new found deviancy, I appreciate what is being shown but does it assist any further than simply drawing the usual supply and demand lines and thus forming the usual channel ?
bracke
Bracke
I regard trading as an excercise in judging and acting on probabilities. There's too much loose talk about Bull and Bear IMHO (present company excepted of course). Both are relative so far as trading is concerned. I am bearish about the medium/long term prospects for UK and US equities but that says nothing about the trading positions I take and there is no way I am going to bet against ftse breaching 5000 this week or next. Having said that I think it likely that there will be a degree of retrace first - otherwise the present RSI outlier will become a gross outlier
(Anyone know the probability of an outlier becoming a gross outlier - probably pretty high I guess 🙄 )
The channels shown are simply statistical constructs that confirm the current upward trend and illustrate the probability of the channel boundaries being breached. Exceptions prove rules as they say so maybe they will be breached, but it will be statistically significant if they are - then again you know what they say about statistics 😉
barjon
Legendary member
- Messages
- 10,752
- Likes
- 1,863
bracke
Oh, that's alright then - I won't take the hump after all. 😆
Interesting time as peter says. 5000 is huge psychologically and if that can be cracked it'll be into that long 2002 congestion range and up against the 50% retracement of the whole 2000-2003 bear move.
good trading
jon
Oh, that's alright then - I won't take the hump after all. 😆
Interesting time as peter says. 5000 is huge psychologically and if that can be cracked it'll be into that long 2002 congestion range and up against the 50% retracement of the whole 2000-2003 bear move.
good trading
jon
peterpr said:Bracke
I regard trading as an excercise in judging and acting on probabilities. There's too much loose talk about Bull and Bear IMHO (present company excepted of course). Both are relative so far as trading is concerned. I am bearish about the medium/long term prospects for UK and US equities but that says nothing about the trading positions I take and there is no way I am going to bet against ftse breaching 5000 this week or next. Having said that I think it likely that there will be a degree of retrace first - otherwise the present RSI outlier will become a gross outlier
(Anyone know the probability of an outlier becoming a gross outlier - probably pretty high I guess 🙄 )
The channels shown are simply statistical constructs that confirm the current upward trend and illustrate the probability of the channel boundaries being breached. Exceptions prove rules as they say so maybe they will be breached, but it will be statistically significant if they are - then again you know what they say about statistics 😉
peterpr
In your earlier post you mentioned previous highs of rsi. On each of those occasions did the ftse retrace and if so by what % ?
What is a gross outliner ?
Would you care to put a figure to the degree of retrace ?
Very useful things statistics, you can use them to say what suits you and ignore that which does not.
Regards
bracke
Last edited:
barjon said:bracke
Oh, that's alright then - I won't take the hump after all. 😆
Interesting time as peter says. 5000 is huge psychologically and if that can be cracked it'll be into that long 2002 congestion range and up against the 50% retracement of the whole 2000-2003 bear move.
good trading
jon
Thank goodness for that. I thought I was in for a good goring !
So the consensus of this thread, ( do two posters make a consensus ) is possible retrace before ftse attempts an assault on 5000, if it succeeds then 5300ish here we come.
Regards
bracke
FetteredChinos
Veteren member
- Messages
- 3,897
- Likes
- 40
if its any consolation, or surprise, im likely to be shorting for the remainder of this month..
setups are looking good for a 100-150 point drop from these level..
whether we climb much higher before then is the gazillion dollar question..
ps, while im here..
any tips on removing ink stains from body parts.
FC
setups are looking good for a 100-150 point drop from these level..
whether we climb much higher before then is the gazillion dollar question..
ps, while im here..
any tips on removing ink stains from body parts.
FC
Just this month? Not for the rest of the year? It's all over for equities! 🙂FetteredChinos said:im likely to be shorting for the remainder of this month..
Techniques vary. Depends whose body and which parts.FetteredChinos said:any tips on removing ink stains from body parts.
barjon
Legendary member
- Messages
- 10,752
- Likes
- 1,863
bracke said:Thank goodness for that. I thought I was in for a good goring !
So the consensus of this thread, ( do two posters make a consensus ) is possible retrace before ftse attempts an assault on 5000, if it succeeds then 5300ish here we come.
Regards
bracke
bracke
weellll, maybe. Needn't necessarily retrace significantly - peter's overbought rsi could be relieved by a bit of sideways with a few attempts at 5000 and maybe a quick looksee over the fence. If it gets over and settles we might see a bit of sideways on the other side and a few attempts to come back rather than a dash up to 5300. fwiw my target stop is just above 5000 and my stoploss (or rather protect profit stop 😀 ) @ 930ish.
fc
Thought you weren't trading atm - can't resist it eh 😆
Inkstains on body parts, what HAVE you been up to?
jon
peterpr
Established member
- Messages
- 609
- Likes
- 7
Last one 7-10-04 retrace 4733 to 4629 in 6 trading days - RSI fell to 50.87, slight bounce then down to 4564 in 6 more days - RSI 46.34bracke said:peterpr
In your earlier post you mentioned previous highs of rsi. On each of those occasions did the ftse retrace and if so by what % ?
1-9-01 6839 retrace to 6205 on 22-9-01 RSI 77.1 to 27.2
12-11-99 6613 retrace to 6564 on 22-11-01 RSI 77.56 to 66.83
Plus a couple of muddy ones with v minor retrace followed by slightly higer highs but lower RSI's. Also, remember I'm using the high of the day for the RSI NOT the close. Doesn't look quite so extreme using the close.
A data point way outside the standard deviation of the rest of the data set.What is a gross outliner ?
The way things look - sentiment and all - not much. Say 4900 - 4950 ?Would you care to put a figure to the degree or retrace ?
You can indeed, but you can do the same with any kind of evidence. They're just bits of evidence that have something to say about the odds - not proof.Very useful things statistics, you can use them to say what suits you and ignore that which does not.
Well we seem to have flushed out a couple of bears are Seymour and Roberto in for a skinning ?
Seymour,Try petrol or turps, that should wipe the smile from your face
barjon
I am still not trading, acting rather as the periot clown ( the one with the sequin suit ) who stirs the pot then keeps out of the way when the muck starts flying. And no comments about me and sequins !
Regards glitteringly
bracke