You are using an out of date browser. It may not display this or other websites correctly.
You should upgrade or use an alternative browser.
You should upgrade or use an alternative browser.
tradesmart
Experienced member
- Messages
- 1,286
- Likes
- 22
Bull flag , or not? Target is 670 if it goes
I’m even more bullish than that CM… (seems to be fashionable lately…!..... 😉 )
Is 10700 in the sights…?
Or an attack on the year high from last February at 10750……?
Go bulls, Go...........
Attachments
No trades for me today due to other commitments.
Looked like an easy day trading the divergences as CM said although with the tight range it would be a case of snatching 20/30 points here and there before reversing the position.
I looked at the VERY long term view (attached), it looks to my inexperienced eye like a flag with a 3,000 odd point pole but I won't be rushing to hold a long position, it took around a year to form the flagpole.
Hope everyone did well today.
Justyn.
p.s. - I don't want to take the post off topic but in case you are wondering from last week... my wife's waters broke today, she is in hospital and if she doesn't go into labour naturally they will be inducing her Wednesday morning so I will have a trainee Dow trader in the making arriving sometime this week.
Attachments
TraderTony
Active member
- Messages
- 180
- Likes
- 1
Monday 15th November 2004
I sat out first move back up off 100 ema shortly after open.
10:02 1) L 10553. This is a bad entry - chased a long bar right at neMonday 15th November 2004
I sat out first move back up off 100 ema shortly after open.
10:02 1) L 10553. This is a bad entry - chased a long bar right at new HOD (high of several months in fact). Too late in. Crawls up to R1 at 10561 (+7). Then drops down quickly.
10:09 EXIT: +1
Then missed a beautiful move right off the 100 ema again (starting around 10:29). Looks like we may have a head and shoulder top around 10:53.
11:13 2) L 10538. Still just about looking for longs so maybe one last chance for some upside off this retracement (not 20 points below 100 ema yet). Going absolutely no where though. Looks like this could be a bear flag consolidation before the next move down.
11:26 EXIT: b/e on lack of follow through.
11:28 3) S 10534. Reversing to short side but I think I may have jumped in prematurely here. Again no follow through. Then a quick pop down to +5 but springs back up to entry.
11:34 EXIT: B/e as it hooks back up.
That was a short taken with the 3m chart still indicating longs, so perhaps a higher risk entry.
Now it's really pulling back to the upside.
12:20 4) S 10542. One more try to see if the down side action is for real. Nope!
12:27 EXIT: -3.
Looks like that was a fake out to the down side as I was just too quick to change my orientation from longs to shorts, especially with the 3m still clearly long.
12:46 5) L 10558. Back to long side well after the resume of up side action. And it comes straight back down.
12:48 EXIT: -5
That was ugly. And then it spins straight back up. This is starting to get really annoying.
12:51 6) L 10561. Back into it again. Very frustrating.
12:55 EXIT: -2.
I need to walk away for a bit - I'm getting whipped to a slow death today.
Then a possible double top at 10570 sends it scuttling back down again.
13:31 7) L 10555. Still no follow through. I must have taken the worst entries today - every one of them. Seems to have maxed out at +3.
13:38 EXIT: +1.
14:40 8) S 10544. Flip flopping back to short side now. Moves nicely and hits +7 before ugly looking reversal type bar. And whips all the way into loss. What a day. Tries another run down and eventually breaks swing low by 1 tick before spring back up again. Then down to +10. Wow! No conviction what-so-ever to the move though.
15:02 EXIT: +5 on taking out swing high.
And up it goes again!
Still in a 42 point range for the day with fewer than 30 minutes of the day left. In that context, I'm actually quite pleased with my performance.
-3 from 8
-11 for the day after commissionsw HOD (high of several months in fact). Too late in. Crawls up to R1 at 10561 (+7). Then drops down quickly.
10:09 EXIT: +1
Then missed a beautiful move right off the 100 ema again (starting around 10:29). Looks like we may have a head and shoulder top around 10:53.
11:13 2) L 10538. Still just about looking for longs so maybe one last chance for some upside off this retracement (not 20 points below 100 ema yet). Going absolutely no where though. Looks like this could be a bear flag consolidation before the next move down.
11:26 EXIT: b/e on lack of follow through.
11:28 3) S 10534. Reversing to short side but I think I may have jumped in prematurely here. Again no follow through. Then a quick pop down to +5 but springs back up to entry.
11:34 EXIT: B/e as it hooks back up.
That was a short taken with the 3m chart still indicating longs, so perhaps a higher risk entry.
Now it's really pulling back to the upside.
12:20 4) S 10542. One more try to see if the down side action is for real. Nope!
12:27 EXIT: -3.
Looks like that was a fake out to the down side as I was just too quick to change my orientation from longs to shorts, especially with the 3m still clearly long.
12:46 5) L 10558. Back to long side well after the resume of up side action. And it comes straight back down.
12:48 EXIT: -5
That was ugly. And then it spins straight back up. This is starting to get really annoying.
12:51 6) L 10561. Back into it again. Very frustrating.
12:55 EXIT: -2.
I need to walk away for a bit - I'm getting whipped to a slow death today.
Then a possible double top at 10570 sends it scuttling back down again.
13:31 7) L 10555. Still no follow through. I must have taken the worst entries today - every one of them. Seems to have maxed out at +3.
13:38 EXIT: +1.
14:40 8) S 10544. Flip flopping back to short side now. Moves nicely and hits +7 before ugly looking reversal type bar. And whips all the way into loss. What a day. Tries another run down and eventually breaks swing low by 1 tick before spring back up again. Then down to +10. Wow! No conviction what-so-ever to the move though.
15:02 EXIT: +5 on taking out swing high.
And up it goes again!
Still in a 42 point range for the day with fewer than 30 minutes of the day left. In that context, I'm actually quite pleased with my performance.
-3 from 8
-11 for the day after commissions
+64 for November so far (7 days trading)
I sat out first move back up off 100 ema shortly after open.
10:02 1) L 10553. This is a bad entry - chased a long bar right at neMonday 15th November 2004
I sat out first move back up off 100 ema shortly after open.
10:02 1) L 10553. This is a bad entry - chased a long bar right at new HOD (high of several months in fact). Too late in. Crawls up to R1 at 10561 (+7). Then drops down quickly.
10:09 EXIT: +1
Then missed a beautiful move right off the 100 ema again (starting around 10:29). Looks like we may have a head and shoulder top around 10:53.
11:13 2) L 10538. Still just about looking for longs so maybe one last chance for some upside off this retracement (not 20 points below 100 ema yet). Going absolutely no where though. Looks like this could be a bear flag consolidation before the next move down.
11:26 EXIT: b/e on lack of follow through.
11:28 3) S 10534. Reversing to short side but I think I may have jumped in prematurely here. Again no follow through. Then a quick pop down to +5 but springs back up to entry.
11:34 EXIT: B/e as it hooks back up.
That was a short taken with the 3m chart still indicating longs, so perhaps a higher risk entry.
Now it's really pulling back to the upside.
12:20 4) S 10542. One more try to see if the down side action is for real. Nope!
12:27 EXIT: -3.
Looks like that was a fake out to the down side as I was just too quick to change my orientation from longs to shorts, especially with the 3m still clearly long.
12:46 5) L 10558. Back to long side well after the resume of up side action. And it comes straight back down.
12:48 EXIT: -5
That was ugly. And then it spins straight back up. This is starting to get really annoying.
12:51 6) L 10561. Back into it again. Very frustrating.
12:55 EXIT: -2.
I need to walk away for a bit - I'm getting whipped to a slow death today.
Then a possible double top at 10570 sends it scuttling back down again.
13:31 7) L 10555. Still no follow through. I must have taken the worst entries today - every one of them. Seems to have maxed out at +3.
13:38 EXIT: +1.
14:40 8) S 10544. Flip flopping back to short side now. Moves nicely and hits +7 before ugly looking reversal type bar. And whips all the way into loss. What a day. Tries another run down and eventually breaks swing low by 1 tick before spring back up again. Then down to +10. Wow! No conviction what-so-ever to the move though.
15:02 EXIT: +5 on taking out swing high.
And up it goes again!
Still in a 42 point range for the day with fewer than 30 minutes of the day left. In that context, I'm actually quite pleased with my performance.
-3 from 8
-11 for the day after commissionsw HOD (high of several months in fact). Too late in. Crawls up to R1 at 10561 (+7). Then drops down quickly.
10:09 EXIT: +1
Then missed a beautiful move right off the 100 ema again (starting around 10:29). Looks like we may have a head and shoulder top around 10:53.
11:13 2) L 10538. Still just about looking for longs so maybe one last chance for some upside off this retracement (not 20 points below 100 ema yet). Going absolutely no where though. Looks like this could be a bear flag consolidation before the next move down.
11:26 EXIT: b/e on lack of follow through.
11:28 3) S 10534. Reversing to short side but I think I may have jumped in prematurely here. Again no follow through. Then a quick pop down to +5 but springs back up to entry.
11:34 EXIT: B/e as it hooks back up.
That was a short taken with the 3m chart still indicating longs, so perhaps a higher risk entry.
Now it's really pulling back to the upside.
12:20 4) S 10542. One more try to see if the down side action is for real. Nope!
12:27 EXIT: -3.
Looks like that was a fake out to the down side as I was just too quick to change my orientation from longs to shorts, especially with the 3m still clearly long.
12:46 5) L 10558. Back to long side well after the resume of up side action. And it comes straight back down.
12:48 EXIT: -5
That was ugly. And then it spins straight back up. This is starting to get really annoying.
12:51 6) L 10561. Back into it again. Very frustrating.
12:55 EXIT: -2.
I need to walk away for a bit - I'm getting whipped to a slow death today.
Then a possible double top at 10570 sends it scuttling back down again.
13:31 7) L 10555. Still no follow through. I must have taken the worst entries today - every one of them. Seems to have maxed out at +3.
13:38 EXIT: +1.
14:40 8) S 10544. Flip flopping back to short side now. Moves nicely and hits +7 before ugly looking reversal type bar. And whips all the way into loss. What a day. Tries another run down and eventually breaks swing low by 1 tick before spring back up again. Then down to +10. Wow! No conviction what-so-ever to the move though.
15:02 EXIT: +5 on taking out swing high.
And up it goes again!
Still in a 42 point range for the day with fewer than 30 minutes of the day left. In that context, I'm actually quite pleased with my performance.
-3 from 8
-11 for the day after commissions
+64 for November so far (7 days trading)
Attachments
Bill
Active member
- Messages
- 160
- Likes
- 1
Hi
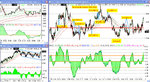
Quite a good day for the channel rules. Possible trades annotated on the chart although I did not take them all I did manage a respectable 28 today. What threw me was a possible bear flag, [showing best on the 5 or 10 minute chart] so I was kind of expecting a fall to around 460ish which never came. Did anyone else see the flag or was it just me 'seeing things' again?
Regards
Bill
+-15 ema Rules are
1. Short if price crosses 100ema and touches/crosses 100ema+15.
2. Long if price crosses 100ema and touches 100ema-15.
3. Short if nd and price is 100ema +15 [or v close]
4. Long if pd and price is 100ema -15 [or v close]
5. Don't trade in the 1st hour
6. Stop losses above/below obvious SR
7. Don't open a trade in the last hour
+ a few more under development
Attachments
tradesmart
Experienced member
- Messages
- 1,286
- Likes
- 22
What threw me was a possible bear flag
Yeh, I saw it Bill, and took it into account, but the nice PD at 485 got me into a long, and just bailed out in a nick of time at 513 (YM), then it tanked after the ND.
Perhaps the flag will still deliver via the ‘indirect’ route, but I was hoping for a test of former support at 525…
Happy days….! ...... :cheesy:
(ps - I see the YM futs have now bounced back up to 515, so the bulls aren't ready to lie down yet...)
Attachments
Last edited:
A mish-mash of not a lot, bar getting in at the open on a gamble and riding down to the bottom 30 min PD. The rest of the day seemed hard, stuck in a 30 point band- ideal whipsaw territory and losses for the unwary.
Seems that closing at HOD ( last night) is not as reliable as I thought as an indicator for more up. But then again, is anything?
Seems that closing at HOD ( last night) is not as reliable as I thought as an indicator for more up. But then again, is anything?
Attachments
TraderTony
Active member
- Messages
- 180
- Likes
- 1
Tuesday 16th November 2004
9:59 1) S 10513 but risky as chasing a big bar at LOD with big gap above. I will set target at 501 for this straight away. Moves down well. Then stalls 1 tick above target. Sod's Law. I'll hold but it is springing back up now. Un real.
10:12 EXIT: +12. Got there in the end but that was nerve racking. Of course, the second move down just keeps on going - that was probably a perfect scenario for splitting the position as other than the big round number (10500) there was no exit signal when I got out (in fact if anything there was a signal to go short just as I got out!).
10:34 2) S 10492. OK, back in but we've had three pushes down and could be forming a base here. Going against me. Will hold on. Then down to new lows but no real momentum now.
10:46 EXIT: +1 after sharp reversal bar from +10 at max. Annoying.
Missed a short on divergence at 11:29.
11:43 3) S 10497. Looked like decent entry on possible breakdown of congestion at 100 ema but after quick drop it snapped straight back up to give a reversal bar and moved into loss. Chose the wrong one to hold on to here - this is looking ugly and doomed.
12:04 EXIT: +1 on potential double bottom, reversal bar, divergence.
Moving back up now from the divergence. It will be interesting to see if it makes a run on the opening gap now.
Flat, flat, flat.
2:00 Looks like we could be breaking to downside. Struggling to find an entry with sudden sharp jumps.
14:30 4) S 10499 on break of reversal bar at 100 ema. Moves straight down then just stops dead. And then pulls all the way back to loss. Crazy action around 10500 - can't decide which way it wants to go. Then back down to take out swing low but cannot break 490. Somethings still holding this up. Then new lows but spikes straight back up with horrible reversal bar.
14:58 EXIT: +1. Well that was stupid. Went +11 at max and I gave all but one back. Could easily have exited on the reversal bar close for +8.
That will do me.
+15 from 4
+11 for the day after commissions
+75 for November so far after commissions (8 days of trading)
Attachments
Bill
Active member
- Messages
- 160
- Likes
- 1
Hi
Difficult day for me. I think I can deal with an up day or a down day and sideways works very well with the channel rules. Where I come unstuck is when there is strong sentiment reversal like today.
Home after 5:00pm and waited patiently to see a rather poorly formed triangle with about a 15 point target. Took the short after the tri break but then closed when I though the target was met only to see far more downside. With the benefit of hindsight it looks obvious but at the time I was really thinking 'up' with just this short pullback before more upside.
The next long at expected support @ 550 quickly took the stop. By now I had changed from bull to bear and was looking for shorting opportunities and the final one [just after 8 btw] paid off. The close was just about perfect at LOD and lots of PD.
So +10 -25 and +23 makes a total of 8 for today and I'm pretty happy with that.
CapitalSpreads was running at about +10 compared to the cash price today in case you are wondering about the entry/exit values.
Regards
Bill 🙂
Edit: Can't count !!
Attachments
Last edited:
TraderTony
Active member
- Messages
- 180
- Likes
- 1
Wednesday 17th November 2004
Wow - I guess if you trade for enough days eventually, by the law of averages, you get a day when you get lucky and nail just about everything. Today was that day for me...
50+ point gap up. May run recent highs at 570.
1) 10:10 L 10571. Missed the breakout of the opening congestion. Could be really late at the party here. Stalling after small push up. Then up more convincingly.
10:19 EXIT: +30 on breaking through 600 level. Again no exit signal so possibly premature.
2) 10:30 S 10601. This is probably not the day to start taking counter-trend divergence trades but this one looks good with tight stop above HOD. Possible double top at high with ND and TLB on indicator. Wow. Question now is whether to cash in a quick near 20 points or hold for a potential run on the lows.
10:39 EXIT: +19. Bottled out on sideways movement.
Turned out to be two good exits but I should have reversed back long with the trend on this second one.
3) 11:07 L 10592. Eventually back in but perhaps too late now. Slowly meanders up to new HOD. With some profit for the day I will let this one run until a clear swing low is taken out to exit.
11:39 EXIT: +13.
11:52 Possible divergence short at double top. It does appear to be a top of sorts but market goes sideways rather than down.
Flat city.
13:35 Looks like it could be breaking down below 600.
13:36 4) S 10597. Not really going anywhere. Then bounces off 89 to give possible reversal bar. Tempted to close out but with some profit in the bank will let it run.
13:52 EXIT: +4. Out too soon as it never broke a good swing high as is probably just forming a flag.
14:00 5) S 10591. Straight back in again. This time it is going. Hits T1 at 570 but this time I'll let it run with a b/e stop to see if it drops all the way to close the gap. And it's going down fast. Next test LOD at 545. Sharp pullback at 14:15 would normally get me out but today I'll risk it. I think this wants to go down more (famous last words). Run out of steam around 550 having got within 1 tick of LOD. Possible PD forming too. Making me nervous. Then hits and takes out LOD. Next target would be closing the gap below 500. I'm tempted to put target to close at 501 and walk away because I doubt it will go down now without a few uncomfortable twists and turns along the way. Stuck at yesterday's HOD of 535. And bouncing harder here.
14:51 EXIT: +44. OK, I bottled out. Closed after PD and TLB on indicator followed by taking out swing high. I still think it will close the gap though.
Now I've bag those profits I'm going to call it quits early and have a beer before the football. I know I should keep going when I'm winning but I've been very lucky today and I don't want to push it any further.
+109 from 5
+104 for the day after commissions
+179 for November so far after commissions (9 days of trading)
Attachments
frugi
1
- Messages
- 1,843
- Likes
- 133
Well done you two!
Chartman I was wondering if I could trouble you with an irksome question?
In your Dow trading summary, as kindly compiled by Newtron, you state (ignoring tops/bottoms etc.)
"Enter a trade on confirmation of a break in the 100 EMA"
"Exit the trade if the price has broken the 100 EMA in the opposite direction +20 points"
Sounds good.
but you also say
"The safe entry is from the price crossing the 100 EMA and waiting for the pullback. For reversing a position this is also the criterion that is used"
So when do you allow for +/-20 and when do you reverse without waiting?
Sometimes it is wise to exit, even reverse, before you have suffered this 20+ point loss. Today was a good example. And sometimes it is not! Are there any clues that help a decision? I guess the answer is at one's discretion, depending on the TA 🙂 It was a bounce down off a century number with ND on the 10 min, for instance ;-)
I'm just annoyed that I lost an extra 20 points today by waiting for it to hit -20 when it looked to me as if the uptrend had terminated a while before. All major indices traded below 20 EMA/5min, nearly tested it, then sold off. I should have trusted myself, but next time I do that it will just be a healthy pullback and I'll kick myself for not allowing +/-20 no doubt!
Last edited:
wasp
Legendary member
- Messages
- 5,107
- Likes
- 880
Not a bad day overall for me.
Played the breakout at 3pm and played it to the double top just before 3.30. I sat out until the crossover just before 7 sold at the pullback after the crossover of the 100ema, and then stayed in until 8.30 on the double bottom.
I was expecting the upside as well but stayed out to see after the small triangle.
I've just been trying to keep it simple and so far its been working okay. Just tradin what I see and trying not too think too far ahead.
+52 for the day
Cheers
Chris
Some good results there guys, esp.TT. :cheesy:
Frugi, the Dow Summary is just a guideline. Nothing works all the time and knowing how to respond to all the various situations will only come with experience.The guidelines are just supposed to keep beginners "safe" and stay in the game. Mostly, it will work, sometimes it will be a bad decision........
The bump and run that was suggested by someone earlier looks spot on now.Doesn't want to give up the 100MA does it?
Attachments
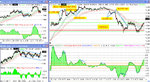
I wouldn't ordinarily take a target off a gapped open, but take a look at ES pre market and you can see the build up for a nice move.Frugi, that triple top should have told you it was all over... It was also at 600, had failed to make T2 and therefore a simple cross on the 100MA would have been ok for an entry. The "safe" entry,just to be sure, is when the price pulls back to the 100MA.
Waiting for the 100MA to go +/- 20 is prudent in the absence of any other overriding reason to get in earlier.It's all about staying safe. Those that know what's what can make their own decisions, be they right or wrong, sooner or later that the safe entry guidelines.Hope that helps.
Notice T3 failure results in a 30 point reversal via a pullback to 530 (532).
Attachments
tradesmart
Experienced member
- Messages
- 1,286
- Likes
- 22
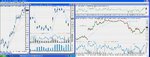
The 'humoured' parallel lines mentioned previously (sometimes known as a trend channel…..!) are holding up well, and the bump and run scenario didn’t deliver to the downside with the indices in such a bullish mood…..
10750 ish to equal this years Dow high is not so far off now, and it seems highly likely that this notional target will be reached quite soon…
However, we saw the index baulk quite markedly at 10600 which is part of a wide band of resistance that the Dow must plough through to get to the ‘summit’ so progress might be slower..
And also the index is testing the lower uptrend line as support and any break of this line could lead to a pullback..
ps - 60min chart attached - could be the start of a new channel moving north at a shallower angle.....?
10750 ish to equal this years Dow high is not so far off now, and it seems highly likely that this notional target will be reached quite soon…
However, we saw the index baulk quite markedly at 10600 which is part of a wide band of resistance that the Dow must plough through to get to the ‘summit’ so progress might be slower..
And also the index is testing the lower uptrend line as support and any break of this line could lead to a pullback..
But I note that any pullbacks now are being snapped up by the bulls – futs now up to 10585, so another test of 600 today seems likely…… 😎"analysts cautioned that the market is likely to hit a period of consolidation soon, perhaps leading into next week's Thanksgiving holiday, when volume tends to be light"
ps - 60min chart attached - could be the start of a new channel moving north at a shallower angle.....?
Attachments
Last edited: