5M Channel Scalping - 100pips \ week

Miki256

Junior member
Messages
43
Likes
17
A strategy I have been trading for a month now... Works great.
Its stupidly simple, but it works.. So I don't mind =]

Basically - I trade only high-probability setups, usually with channels.
I focus on tight stop loss, reasonable Risk:Reward ratio and pre-calculation of take profit. I don't use indicators nor trailing stop loss of any kind. I like 'Fire and forget' type of strategies - Enter and go back to sleep hahaha.

I will write a thorough guide later, with instructions of the exact place to enter, how to determine Stop Loss and Take Profit.

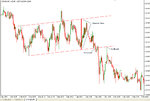
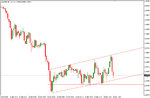
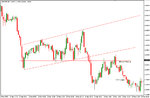
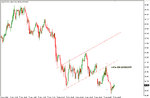
Meanwhile.. Enjoy these examples:


Very much like method, looking forward to more postings / potential trades. Good work buddy. Especially on tight stops, gotta love them.
 
So like I said I am going to post the system here....

First of all, the main thing is the entry.
My entries are based on pullbacks, so we are going to start by learning how to identify a pullback.
Pullback occurs when price retests a level it broke in the past. So if you look at the chart I attached.

We see that price had broken through a support line, and tested it.
If price goes down (a bearish candle was formed) I will enter the trade.
For longs the story is a bit more complicated, so please be patient...

How exit is calculated:
First of all, calculate the channel size - Decide on a price point, and subtract the price of support from the price of resistance.
Look at the chart I provided to learn how I calculate channel size.

These are the basic rules. More tips about this strategy and extended rules are available here.

I will post daily trades here so you guys could learn and profit too! :)

Good trading everyone!
 

Attachments

  • 6.jpg
    6.jpg
    236.6 KB · Views: 1,231
Yes this loooks OK.

But it looks OK after a successful outcome.

Where does it account for S/R.

The discretionary channels,much like a trendline, can work well if you are lucky enough to draw them in the right place, but in themselves do not show you areas of support or resistance. Akin to trying to pin the tail on the donkey really for the entry.

These charts look great after the fact, but trying to pin the entry in realtime is a different kettle of fish IMO.

Also, the 50-70 targets seem a little random. What is the reason behind them.
 
Last edited:
Yes this loooks OK.

But it looks OK after a successful outcome.

Where does it account for S/R.

The discretionary channels,much like a trendline, can work well if you are lucky enough to draw them in the right place, but in themselves do not show you areas of support or resistance. Akin to trying to pin the tail on the donkey really for the entry.

These charts look great after the fact, but trying to pin the entry in realtime is a different kettle of fish IMO.

Also, the 50-70 targets seem a little random. What is the reason behind them.

You are right, you have to know how to draw S\R right. This is an important skill for every trader no matter what system you are using. I will try to cover this up but at the end it only comes with practice.

Even if you have zero practice, after you see three bounces off a certain trendline you can say with confidence that you have identified it correctly. Pointing the entry, especially for pullbacks is easy because you already have assurance for the trendline's validity. Just look at the examples, and more importantly try to find these trades yourself. They exist in every pair, just look for them.

Regarding the exits:
I have explained in my previous post how the targets are calculated. Check the section - "How exit is calculated".

Good trading :)
 
An interesting thread and I see in your first post that all examples are using 15M charts apart from the last one which was 5M. Do you use both ?


Paul
 
Looks like a nice 2nd b/o system from an identified channel, works well too for congestion period, either that or a thrust (implying momwentum) out of the channel/congestion. I was curious too as to whether you use mainly 15min and occassionally 5min t/f's or do you look for any t/f that has an obvious and identifiable channel??

Thanks for posting, amongst all the other crap to be found here and other places it is something that I am sure may be of interest/use to others.
 
You are right, you have to know how to draw S\R right. This is an important skill for every trader no matter what system you are using. I will try to cover this up but at the end it only comes with practice.

S/R exists along a horizontal plane. You are not identifying S/R.

Even if you have zero practice, after you see three bounces off a certain trendline you can say with confidence that you have identified it correctly. Pointing the entry, especially for pullbacks is easy because you already have assurance for the trendline's validity. Just look at the examples, and more importantly try to find these trades yourself. They exist in every pair, just look for them.

Assuming you'd drawn the trendline in the right place to start with which may not be the case.

Regarding the exits:
I have explained in my previous post how the targets are calculated. Check the section - "How exit is calculated".

Good trading :)

.
 
S/R is the same as supply and demand. I don't think it necessarily only exists along a horizontal plane. Some good posts on potential setups (i think by either paul or joey) illustrate this well.

It's not really nice to critise someone else's way of trading unless it's completely far out or unprofitable / high risk.

I would let him post some setups first. I know that this thread is purely for advertising his blog but you should at least give it a chance.
 
My criticism is always constructive. Aimed at furthering insight, improving areas of weakness, and if those areas of weakness can't be improved, it is a non-starter. Never mistake constructive criticism for insults.
 
Check out that trade from Friday.
Trust me, after I start posting live trades here you will doubt my system no more :cool:

An interesting thread and I see in your first post that all examples are using 15M charts apart from the last one which was 5M. Do you use both ?
Paul
I use both as these patterns occur on 5M and 15M (Actually, on most timeframes).
I doesn't matter on which timeframe you take these trades as long as your entry is right.
 

Attachments

  • 7.jpg
    7.jpg
    181 KB · Views: 456
  • 9.jpg
    9.jpg
    210.2 KB · Views: 551
Trading plan for next week:
3 Set-ups in the making, if a pullback will occur I will enter.


Your third chart of EURUSD looks to me that it is already at the point of support based on my understanding of your approach ?


Paul
 
Your third chart of EURUSD looks to me that it is already at the point of support based on my understanding of your approach ?


Paul

My understanding is that if the channel breaks in either direction and a pullback occurs from below/above the now broken channel to the previous support (now potential resistance)or resistance (now potential suppport) provided by the lower/upper channel respectively, then that and a price action confirmation like a pinbar, engulfing etc will be the trigger for entry in the direction of the channel breakout. Essentially it is a channel/congestion 2nd b/o system.

G/L with these trades Miki256 and thanks for posting the potential set-ups
 
Your third chart of EURUSD looks to me that it is already at the point of support based on my understanding of your approach ?

Paul

That's right. I think price will gap on the opening, and than I will wait for a pullback

bbmac - you couldn't have summarized it better.
 
Anyone who had traded the set-ups I posted would have made 3% on his account :clap:

How's that for an exact entry?
 

Attachments

  • usdjpy.jpg
    usdjpy.jpg
    124.1 KB · Views: 475
Nice trade well done. Do you only trade channel breaks and price pull backs in direction of the channel ?

Ie: Like the EJ 15min descending channel in your example in post above, the descending channel broke to the downside in direction of the channel (ie descending) then price pulled back and found resistance at the broken descending channel. If that descending channel had broken to the upside and price pulled back to the still descending channel would that have been potential support for you?

Similarly if an ascending channel breaks to the upside, ie in direction of channel and price pulls back to the still ascending channel that is potential support-well and good, but if that ascending channel had broken to the downside and price had pulled back to the still ascending channel would that have been potential resistance for you?

Thanks.
 
Last edited:
Nice trade well done. Do you only trade channel breaks and price pull backs in direction of the channel ?

Ie: Like the EJ 15min descending channel in your example in post above, the descending channel broke to the downside in direction of the channel (ie descending) then price pulled back and found resistance at the broken descending channel. If that descending channel had broken to the upside and price pulled back to the still descending channel would that have been potential support for you?

Similarly if an ascending channel breaks to the upside, ie in direction of channel and price pulls back to the still ascending channel that is potential support-well and good, but if that ascending channel had broken to the downside and price had pulled back to the still ascending channel would that have been potential resistance for you?

Thanks.

If channel is ascending I will take short pullbacks, and won't take long pullbacks as they are unreliable.
If channel is descending I will take short and long pullbacks.

So the answer is Yes and Yes.
 
If channel is ascending I will take short pullbacks, and won't take long pullbacks as they are unreliable.
If channel is descending I will take short and long pullbacks.

So the answer is Yes and Yes.

Thank you for the reply, I am still not very sure, I hope you might be able to add some more clarity. - do you then only consider trading pullbacks after price has broken in the direction of the channel? For eg; if an ascending channel, price breaks out of channel to the upside, pullsback and the upper now broken channel may act as support, at which you look for a decent price action trigger (such as pinbar/inside bar/engulfing etc?)

-or-

Is it that (continuing with this ascending channel example) if price breaks to the downside out of the lower ascending channel and pullsback tio the now broken lower ascending channel, you will considwer that this may act as resistance and would trade it if there was a decent price action trigger?

Thank you for your help.
 
Top