I'm hoping that by forcing myself to keep a record of my trades (set up, entry, exit and targets) I might learn some discipline.
To date my record keeping has only been a cursory glance at my account balances
My trading objective is to identify opportunities for what I would describe as 'medium term' swing trades, by which I mean I am happy to hold an open position or unfulfilled order overnight and over a weekend.
I have been looking mostly at forex dollar pairs (gpb, eur, aud, nzd, cad, chf, and jpy) and eurgpb, eurjpy as well as gold, silver, ftse, dax & SnP.
I am looking at the 4 hourly time-frame for trend direction, using a 20ema and 50sma, I also look at the daily time-frame for its trend but contradiction between the two do not necessarily mean I don't take a trade. I also note the previous week and monthly time-frame swing high and low points and if the last [weekly or monthly] candle printed was an 'obvious' candle stick formation.
If I have a 4 hour trend (an uptrend would be where price is trading at a higher level than the 20ema, which is placed above the 50sma) I would look out for price pull backs to the 20, or between the 20 and 50) to levels which have recently acted as Support / Resistance on the 4 hourly, or lower time-frames. I then look for a candle-stick formation on the 4 hourly or lower time-frame that indicates strong rejection of the lower price level (a hammer or 'pin' being the most obvious example) to trigger me into the [4 hour] trend.
I make sure that I know when the major news releases are, as these often produce trade entries. I also am a member of the FX500Club and read what Christian Tegllund Blaabjerg writes each day in his 'wake up call' at Saxo Bank.
I have suffered many stop out's to date by playing such 'hammer' candles with an order entry at 1 pip above their high and a stop 1 pip below their low, so have recently changed my approach to putting the stop 1 pip below the last 4 hourly swing low. This often means quite large stops in terms of pips, much larger than most traders would accept. I only have a small account and I stake at minimum value per pip and will do so until I can increase my stake size without exceeding 5% of my account balance on one trade.
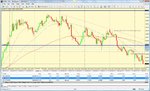
I hope that my approach makes sense to anyone that takes the time to read it. I will post some charts in time to hopefully clarify. It is said that a picture tells a thousand words.
To date my record keeping has only been a cursory glance at my account balances
My trading objective is to identify opportunities for what I would describe as 'medium term' swing trades, by which I mean I am happy to hold an open position or unfulfilled order overnight and over a weekend.
I have been looking mostly at forex dollar pairs (gpb, eur, aud, nzd, cad, chf, and jpy) and eurgpb, eurjpy as well as gold, silver, ftse, dax & SnP.
I am looking at the 4 hourly time-frame for trend direction, using a 20ema and 50sma, I also look at the daily time-frame for its trend but contradiction between the two do not necessarily mean I don't take a trade. I also note the previous week and monthly time-frame swing high and low points and if the last [weekly or monthly] candle printed was an 'obvious' candle stick formation.
If I have a 4 hour trend (an uptrend would be where price is trading at a higher level than the 20ema, which is placed above the 50sma) I would look out for price pull backs to the 20, or between the 20 and 50) to levels which have recently acted as Support / Resistance on the 4 hourly, or lower time-frames. I then look for a candle-stick formation on the 4 hourly or lower time-frame that indicates strong rejection of the lower price level (a hammer or 'pin' being the most obvious example) to trigger me into the [4 hour] trend.
I make sure that I know when the major news releases are, as these often produce trade entries. I also am a member of the FX500Club and read what Christian Tegllund Blaabjerg writes each day in his 'wake up call' at Saxo Bank.
I have suffered many stop out's to date by playing such 'hammer' candles with an order entry at 1 pip above their high and a stop 1 pip below their low, so have recently changed my approach to putting the stop 1 pip below the last 4 hourly swing low. This often means quite large stops in terms of pips, much larger than most traders would accept. I only have a small account and I stake at minimum value per pip and will do so until I can increase my stake size without exceeding 5% of my account balance on one trade.
I hope that my approach makes sense to anyone that takes the time to read it. I will post some charts in time to hopefully clarify. It is said that a picture tells a thousand words.