barjon
Legendary member
- Messages
- 10,752
- Likes
- 1,863
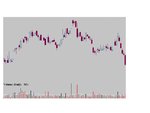
ok, something different this time.
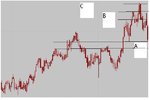
Another one that has been rising for some time with the highs here representing all time highs.
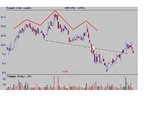
I'll show more of the history in the next post for those uncomfortable with the single (daily) timeframe.
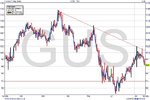
So without more ado, wot happened next and do you smell a trade coming on? If so with what entry and with what target and what stop?
Over to you
good trading
jon
edit: tried for a better chart - this cut and paste's a bind 😈
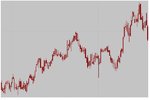
Another one that has been rising for some time with the highs here representing all time highs.
I'll show more of the history in the next post for those uncomfortable with the single (daily) timeframe.
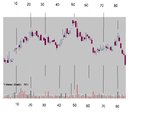
So without more ado, wot happened next and do you smell a trade coming on? If so with what entry and with what target and what stop?
Over to you
good trading
jon
edit: tried for a better chart - this cut and paste's a bind 😈