AEX Cycle Analysis

rodo

Junior member
Messages
16
Likes
0
Time and price Analysis AEX

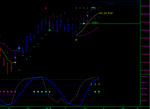
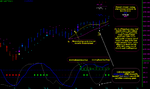
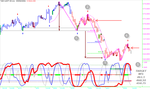
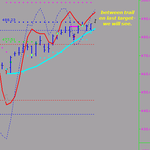
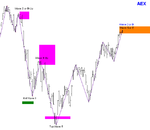
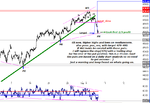
op 31 jul 06 vele signalen voor de W C van W 2 top:

* prijs is 100% van de move van Wave A
* reversal bar
* twee prijs fib's op 31-jul-06
* draai van de Oscilator
* in de timingbands voor potentiele top zone (dag en week cycle)
 
Last edited:
Het kwam me al bekend voor, heb er zelf ook aan gesnuffeld maar nog niet de juiste Cyclus insteek gevonden... de vermeende regelmaat blijkt in de praktijk namelijk niet aanwezig... de uit de analyse verkregen indicaties zijn me veel te grofmazig en te vaak gewoon simpel gezegd foutief.... en er op handelen is dus een kostbare zaak.

Om eens inhoudelijk te worden... de gerefereerde 4 jaars cyclus.... deze komt meestal bij de ami's vandaan... daar lag de vorige low in oktober 2002... die van ons was maart 2003.... welke moet men dan hanteren... er zijn al wat ami's die de volgende opschuiven.... zo tweede helft 2006 maar het kan ook nog eerste helft 2007 worden.... daar kan ik geen zakgeld mee verdienen....

De in uw (en de fruitboer) grafiekje aangegeven relaties zijn op fibo verhoudingen gebaseerd terwijl Gann een ander verhouding hanteert welke vaak beter werkt... dan is er de overlap tussen de Gann en Fibo waarden die vaak heel erg to the point blijken te zijn....

Maar ik ben heel erg benieuwd naar uw bevindingen aangezien Cyclus Analyse wel mijn belangstelling heeft al moet ik bekennen dat de gebruikte huidige technieken bepaald geen windeieren leggen...

Groet.
 
Rodo,

Interessante analyse. Op basis van de cyclus analyse volgens R. Merriman kom je ongeveer op dezelfde data uit. Hij beperkt zich echter voornamelijk tot de weekcyclus. Zou je aan kunnen geven op welke basis jij de dagcyclus hebt berekent?

Ivo
 
Daily cycle still up - minor target has been reached (463-464)
if the AEX turns from this zone and breaks todays low, we have the first signal to short the index or buy puts.
I am long calls from 454 level and took 50% profit at my first target. next tragets are 468 and the 473-477 zone. with respect to the trailing stop (around break-even point) in the mean time or cycle direction change.
In the weekly chart the AEX is at .786 retr. level, prices are in the timing-band top-zone and is reaching over-bought level. At this point best gues is a lower weekly cycle high for the AEX.
But as long as the daily cycle points north I will be careful to short this market - I like to see proof first.
 

Attachments

  • aex d-w.png
    aex d-w.png
    77.3 KB · Views: 485
Rodo,

Welke software gebruik jij voor deze analyses? Profittrader van Walter Bressert of andere software? Ik neem aan dat de timebands door de software zelf gegenereerd worden?

gr. Ivo
 
fractale vergelijking aex

in de grafiek zien we een patroon vergelijking van de aex.
waarin we de top van febbe 2004 en de dalingspatroon van toen vergelijken met de huidige. Dit is slechts een mogelijkheid, zolang dit patroon geldig is. volgt de AEX een ander pad, gelijk in de prullenmand gooien dan. meer over fractals hier te zien: http://www.elliottfractals.com
in de tweede grafiek zien we de dagcycle. De Timingbands voor volgende cycle low ligt tussen 6 en 21 sept 06. De richting is nog steeds omhoog - top in huidige cyclus verwacht ik binnen enkele dagen (status is nu 6 TD en 8 CDays) qua prijs dus 464-474, na bevestiging dag(week?) cycletop is het 446.34 prijsniveau van belang. hieronder hebben we dus de eerste lagere low sinds opwaartse correctie vanaf 409.56. Hierover later meer indien van toepassing.
In de laatste grafiek een Elliott Wave telling - ik gebruik dit voornamelijk om koersdoelen te berekenen en structuur van de golven in klaart te brengen. Verder heb ik geen diepgaande kennis van het EWP. is mij te ingewikkeld :)
 

Attachments

  • fractal aex.png
    fractal aex.png
    44.7 KB · Views: 2,204
  • cycle update 19-8-06.png
    cycle update 19-8-06.png
    11.5 KB · Views: 411
  • AEX EWP.png
    AEX EWP.png
    7.8 KB · Views: 426
Last edited:
Trend omhoog blijft intact - markt beslist over de positie ik volg.
 

Attachments

  • aex-d.png
    aex-d.png
    38.7 KB · Views: 420
vandaag profitstop geraakt - calls verkocht. al met al moeizame trade. in de chart zijn de zijwaartse periodes in een grijs blokje gezet. veel stilstaan en af en toe een toefje omhoog. Ik zit nog niet in de puts om evt in te spelen op komende cycle low. één en ander afhankelijk van het slot.
 

Attachments

  • aexday.png
    aexday.png
    13.2 KB · Views: 313
see the charts for more information
 

Attachments

  • aex daily.png
    aex daily.png
    31.2 KB · Views: 286
  • aex15 min.png
    aex15 min.png
    29.4 KB · Views: 335
  • AEX30.png
    AEX30.png
    97.7 KB · Views: 305
Last edited:
trail took me out the puts and buysignal with the trend took me in the calls. cu
 

Attachments

  • aex.png
    aex.png
    21.7 KB · Views: 292
This last trade had a slow start, but is now moving up to new 4 year highs. Last 3 days if have sold 2/3 of the calls position. Time and price have got to the Timing(top)Bands, +/- 488 next goal to take some more money from the table. The trail or cycle direction change will protect the 1/3 calls.
I talked about a poss. of a lower weekly cycle top, but the AEX is trading higher now. I also mentioned that the trend is up (daily, weekly and monthly) and as long as the direction is up, I will buy the daily cycle lows.
With nice buy setup/triggers, realistic price/time targets and stop/trailngstop and not to forget sound moneymanagement and the right state of mind - you sould make some money.
 

Attachments

  • AEXD.png
    AEXD.png
    109.1 KB · Views: 275
Hi could you please tell me what the indicator is ? many thanks
 
Last edited:
the one below is a tend indicator - build from fast and slow moving averages, it's a simple but effective way to determine trend direction
 
Thanks rodo , i was more interested in the banded indicator which looks a bit like stochastics or something. thanks again
 
yes henry that indicator is the smoothed stochastic - it travels nicely between overbought and oversold. most cyclelows and highs are triggerd.
 
so today 488+ has been hit - Just a small position left for higher prices.

and as I posted earlier - follow the price action - don't predict.
 

Attachments

  • AEX51006.png
    AEX51006.png
    63.2 KB · Views: 221
2 charts 4 words :)
 

Attachments

  • aex1010.png
    aex1010.png
    8.9 KB · Views: 229
  • i-aex.png
    i-aex.png
    75.6 KB · Views: 227
Last edited:
today again higher cycle low on hourly basis, with the daily uptrend. as you can see a smaller intraday time frame can give low risk-high dollar opp. it's a nice way to add on some to the main position. (don't forget total risk control and MM rules)
the AEX is in a up "wig" so the swings getting smaller - most of these patterns will break to the downside (last wave little bit above upper trend line and back in the formation can be a good sign for that)

sentiment still bearish to neutral - I like to see a change in this - before or at the 4 year cycle top.
 

Attachments

  • aexh.png
    aexh.png
    81 KB · Views: 251
Last edited:
Top