You are using an out of date browser. It may not display this or other websites correctly.
You should upgrade or use an alternative browser.
You should upgrade or use an alternative browser.
Articles
Filters
Show only:
Loading…
Anyone who has studied options knows that there are six basic factors that make up the price of an option. They are, the price of the underlying, strike price, days until expiration, dividends, interest rate and volatility. I thought this might be a good time to review all of these factors and how they influence an individual options price. I am choosing to do this review in more of a straight forward way rather then a purely mathematical way. There are many excellent books that use great mathematical models in explaining options, but I believe that for terms of a review we can look at some real life examples and learn from those situations. The purpose of this review is to help you to make better decisions on which options to...
I use chart patterns in my trading because they give me tips on how a stock will perform. Sometimes the tip turns out to be a lie, but that's okay. I use stops to limit losses (don't you?). When the tips are accurate, I clean up. This article discusses two such tips: partial declines and partial rises. They forecast the breakout direction from a chart pattern.
When I wrote this in January 2003, we were still in a bear market, and so I concentrated on partial declines -- they predict upward breakouts. What does a partial decline look like? Consider Figure 1, a chart of a broadening bottom. That's my term for what's usually called a broadening top, but I found performance differences between tops and bottoms. For the latest statistical...
Ever taken a breakout trade only to see your quick profits erode into a loss? Ever been "sure" that you were on the right side of the markets, only to see price reverse sharply, shake you out and then resume its original course? You may have been the victim of program trading.
Program trading is defined as the purchase or sale of a basket of at least 15 stocks with a total value of $1 million or more and developed as result of 3 primary factors:
Individual investors are learning the value of a diversified portfolio. After the "Bubble Burst" of 2000, many people realize that the old warning not to put all your eggs in one basket has some practical application in trading.
Institutional activity is at record levels because the "Big...
Based on comprehensive studies of the greatest stock market winners going back each decade, the biggest winners of all time consistently show the same seven performance common characteristics before they make huge price advances. These are the stocks that produce 100%, 500%, sometimes even 1,000% and a lot more in returns. Most of these winners were not yet household names, and yet, they were well-managed companies that began to build profits, and the necessary steam to make major price moves. CAN SLIM™ represents a checklist for those common performance characteristics, with each letter standing for a key trait any great stock will possess in its emerging stages. Independent studies by The American Associate of Individual Investors...
The markets offer an endless stream of opportunities to trade. Each trade or series of trades provides the chance to wipe the financial slate of the past clean, find trading redemption, and claim the lucrative future. Each trade has the potential to announce that your dues are paid, that you are maturing as a trader, and that finally you are poised to enter the elusive circle of consistent winners. The lure and promise of financial freedom through the clicks of a mouse offers a sense of adventure, challenge, and stimulation rarely matched in other activities or professions.
Only a very select few are able to ascend and remain atop this Darwinist ladder and garner consistent profits. The majority of traders find themselves nursing a...
One of the most common pieces of advice trading mentors give to their students is the keeping of a trading journal. By documenting your trading, the common wisdom holds, you can learn what you're doing right and wrong and speed your learning curve. I happen to be quite a fan of trading journals; indeed, I made journals a mandatory part of the training program at a Chicago-based proprietary trading firm. All too many times, however, I found that the journals did not accomplish their purpose. They became rote exercises that did not get to the heart of either trading problems or solutions. So I thought in this article I'd outline the five most frequent shortcomings with journals and how these can be addressed.
The journal lacks...

Some of the best investing and trading results I have had in recent years have been from riding on the coat tails of investors far brighter than myself, investors who have done far more research on a company than I will ever be inclined to do myself.
It can be a tedious process following all the dealings that get reported through the RNS announcements, but I try to maintain a list of major stakes and holdings in nearly three hundred UK companies. This allows me to keep track of who is increasing or decreasing their stakes in certain key companies. (see this sample)
Companies Act disclosure requirements allow private investors to keep track of the activities of shrewd investors who have a proven track record of successful investing...
Just a mere decade ago, most investors had to depend heavily on the Wall Street "professionals". Research and technical investment information was difficult to access other than through the brokerage firms. Fortunately, the advent of internet investing has completely altered the limitations that most investors had to overcome; getting information to do their own analysis.
The past decade has witnessed tremendous advances in the utilization of computer generated technical analysis. The average investor now has the capability to create any investment trading program that they can imagine. The abilities of computers have been able to greatly enhance the performance of successful investment methods. The candlestick trading method has been...
Being English (although I am now a Naturalised Aussie too) I am a huge soccer fan. This season my club Liverpool have enjoyed a wonderful run of success in the European Champions League, the most prestigious club competition in the world and they will play in the final which takes place before this edition hits the newsagents. Imagine my glee therefore when I was sent the following statistics in an email before the Quarter-finals which took place a few weeks ago:
LIVERPOOL FC ** Too much of a coincidence?? You decide.
1978 - Welsh Grand Slam. Pope Dies. Liverpool win European Cup
2005 - Welsh Grand Slam. Pope Dies. ???
1981 - Prince Charles gets married. Ken and Deirdre marry on Coronation Street. A new Dr Who is appointed...
Have you ever thought about pulling the plug on your trading operation? I think a lot of folks have, including me. It's easy to quit but it takes perseverance to ride the storm out and stick with the game. Trading is no different than other endeavors you need a plan, some luck but most of all dedication to hard work and research.
This all sounds good on paper. Imagine some guy telling you how to handle your trading business. It's easy to read and then dismiss the ideas or you can really take them to heart but the reality is that until you come up with a rock solid approach you may be spinning your wheels
Drawdowns
I've seen a lot of friends and clients call it quits and 9 times out of 10 it's all related to drawdowns. People tend to...
Support and resistance levels on bar charts are a major component in the study of technical analysis. Many traders, including myself, use support and resistance levels to identify entry and exit points when trading markets. When determining support and resistance levels on charts, one should not overlook the key Fibonacci percentage "retracement" levels. I will detail specific Fibonacci percentages in this feature, but first I think it's important to examine how those numbers were derived, and by whom.
Leonardo Fibonacci da Pisa was a famous 13th century mathematician. He helped introduce European countries to the decimal system, including the positioning of zero as the first digit in the number scale. Fibonacci also discovered a...
There are some common mistakes I've seen traders make in the area of money management. First, let's understand what money management is all about.
Money management overlaps with risk, trade, business, and personal management, yet it has many aspects that make it unique, distinctly different from all of the other areas of management. In this article we want to examine some areas of money management that seem to involve mental quirks leading to costly mistakes.
Listening to Opinion
Kim has entered a short position in crude oil after carefully studying as many factors as she could reasonably include while making her decision to trade. She has entered the trade because her study of the underlying fundamentals has her convinced that...
Systematic or discretionary? It's an important question on the way to trading success. Most traders eventually end up belonging to either one or the other philosophical camp. In this article, Harald Weygand introduces an approach that most likely will interest the discretionary traders among our readers.
Traders and chartists can be categorised in various ways. Among the possibilities are system traders and intuitive chart readers. System traders develop a comprehensive set of rules, weighing statistics, utilising vast arrays of indicators and weaving intermarket correlations. Finally they combine several systems after extensive back testing. The computer, not the person, screens the market applying the system. System traders with...
"The most merciful thing in the world..." H.P. Lovecraft writes in his horror story The Call of Cthulhu, "is the inability of the human mind to correlate all its contents." To be sure, if all our memories and perceptions registered in the mind equally, we should be like the unfortunate Funes of the Borges tale - completely overwhelmed by the sum of our experiences, unable to act. Yet, as Freud realized, we pay a price for this compartmentalization. The conflicts, urges, and passions that we sacrifice in the interest of present concern do not merely vanish. Like Cthulhu, they lie beneath the depths; in the apt phrase of The Fields of the Nephilim, "dead but dreaming". They call to us when our emotional stars are aligned, waiting for...
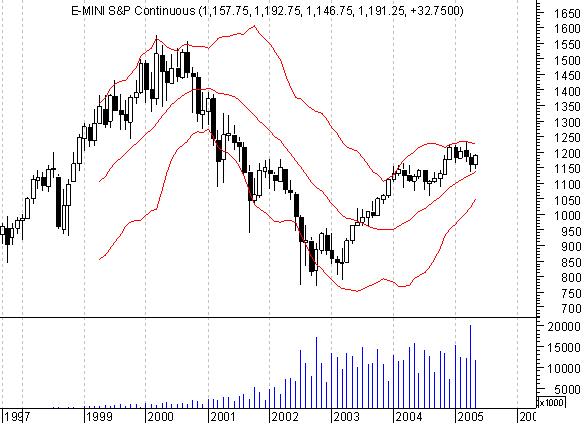
In this article we present a simple trading system that we developed based on the concepts outlined in The 10 Power Principles of Successful Trading Systems.
Step 1: Selecting a market and timeframe
One of the most popular markets these days is the e-mini S&P, and that's not without a reason: It's a 500 company index. One of the largest in the world and that means you have excellent and consistent liquidity, superb volatility, tremendous leverage and no uptick rule. It's a truly bi-directional market that shorts just as easily and safely as going long. It's a fully electronic market, offering all the advantages of electronic contracts.
We decide to trade the market intraday, i.e. we will enter and exit a trade on the same day, because...
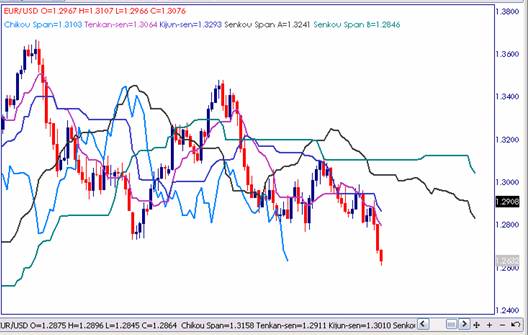
The Ichimoku Kinkou-Hyo is a technical study that was developed by a Tokyo newspaper writer, Goichi Hosoda, before World War II as a self-standing forecasting method for all financial markets. The name is a bit of a mouth-full, so many traders only call it Ichimoku, but in loose translation the full name means "One-look at the equilibrium prices." The name originated with Hosoda's pen name "Ichimoku Sanjin," which means a glance of a mountain man. This technical study consists of gauging midpoints of historical highs and lows at different lengths of time and several time lengths matched those used in the MACD's moving averages. Ichimoku provides another method of analyzing trends and brings additional points to retracement/extension...
There are literally thousands of traders out there who have brains, motivation, money (but not for long), big computers, trading software, newsletters, trading magazines, courses and more, but who can't make money. I call them "Johnny and Jane", because they're typical and engage in losing behaviors common to so many traders. The sad but true fact is that in spite of all the advances we have made, too many traders still fail. But why? Why is it that "Johnny and Jane Can't Make Money in the Markets" consistently or successfully? Here are some of my thoughts. I hope they help you in your trading plan. Hopefully you won't end up like Johnny and Jane or if you're already a Johnny or a Jane (or both) my thoughts will help you improve your...
Throughout the years I've been trading and writing I've often written about mind set - having the right frame of mind for your trading so you become a winner.
I've stated that it is our job to trade "futures," not "histories."
The future is the next bar on your chart. You can't possibly know how it will develop, how fast prices will move, or where it will end up. Since none of us know where the very next tick will be, it's impossible to know where the tick after that will be, or the tick after that, etc. All we know at any one time is what we're seeing. Interestingly, what we're seeing may not be true.
Trouble With Data
If we are day trading, we are not sure that what we're seeing is a bad tick, especially if it is not too far...
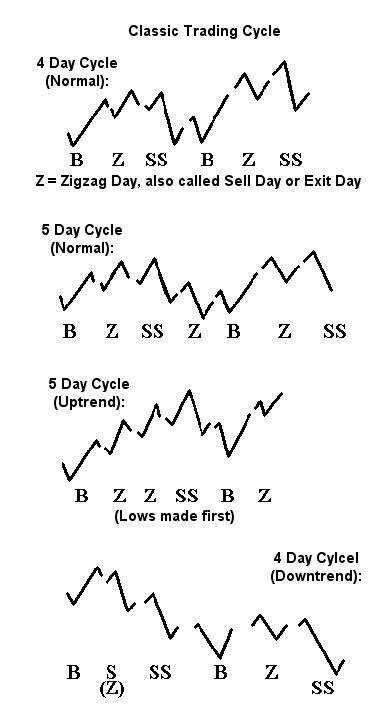
My personal trading style is based on a method described in the 1950s by a veteran floor trader named George Douglass Taylor. The "Taylor Trading Technique" is a short-term method for trading daily price movements that relies entirely on odds and percentages. It is a method as opposed to a system. Very few people can blindly follow a system, though many find it easier to be discretionary in a systematic way.
Because this short-term swing technique generates frequent trades, it is important to know the correct plays, when to lock in profits, and when to seek the true trend. Taking a loss is merely playing for better position. One trades strictly for probable future results, not for what the market might do.
To know the correct play is...
This article is essentially for anyone starting out in the markets, but the question of why one is trading is relevant at all times.
The question as to what motivates the individual to start trading or continue trading is very important because many reasons are poor reasons and the so-called "motivators" can contain hidden traps.
Often people trade for a number of reasons, not just the obvious one of wanting to make money, and frequently these other reasons are at a sub-conscious level, and would not normally be disclosed if someone asked the question "Why do you trade?"
Below is a list of motivators. This is designed to be fairly comprehensive and typically three or four from the list will apply to each individual. Clearly not...
It is appreciated that Trade2Win is first and foremost a "technical analysis" site. Those that know of me from T2W may be aware that my methodology is one of "fundamental analysis". From this rather black and white perspective, what do I have to offer the committed technical analyst? I offer you the
price/earnings ratio.
The P/E ratio, as it is more commonly referred to, lends itself well to the non-financial analyst for a number of reasons. I shall suggest a methodology that is hybrid in nature, combining the P/E ratio (exclusive of any knowledge, or reference to, the financial statements) with a technical chart that acts as a filter for the P/E ratio, imbuing the P/E's calculation with a factor of safety. We shall end up with a...
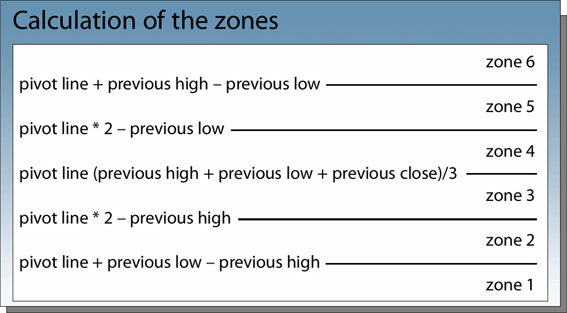
Pivot zones can be very revealing to traders. J.T. Jackson has conducted extensive statistical research on a variety of US markets. His research has shown that traders can use daily market action to determine specific probabilities for price to trade within a certain area, and also to highlight support and resistance areas for the following day. These statistics can help enhance the quality of trading signals and (increase the "hit rate" - or number of winning trades). Additionally, these statistics offer insight into the current trend of the market and can signal the underlying strength of the trend. In the following article, this concept is applied to the Dax future, using end-of-day data for the period from 1998 to 2003.
The concept...
There are many good penny stock investments available, which could turn a small amount of capital into a small fortune very quickly. However, to discover these you need to know what to look for and what to avoid. When searching for that one big payoff, steer clear of the following examples.
The Phone Salesman - Anyone who is attempting to sell you investments over the phone should be considered an enemy. They have high-pressure sales tactics, and effective, believable arguments. However, they are not doing you any favors, no matter how good they make an investment sound.
They are operating in their best interest to dump over-the-counter stock on you, and the money you pay in will go into their own pockets, or the pockets of their...
Why is this a good time to invest in the U.S.? Believe it or not, but it may be because of the deficit! Amid all the hand ringing and gnashing of teeth by politicians of both political parties over growth of the federal budget deficit, evidence suggests that right now may be the best time in a decade to be saving and investing.
Revisiting the bursting of the bubble
To fully appreciate why now may be a good time to invest in U.S. stocks despite record high deficits, it would be time profitably spent to revisit the spring of 2000 just before the tax deadline. The government was running a record budget surplus for the third straight year, and the stock market was at an all time high. During the week leading up to April 15 indices started...
Most traders tend to use technical analysis to pick their entry and exit points when trading, and swear by those methods, but if it were really that good why are there so many variations? More importantly, why do so many technical traders lose money? The answer is quite simply that they are using charts to predict the probable future price movement, based on patterns. Now that is okay but it is only slightly different from a gambler who might say that, based on the fact that there are 36 number cards and 16 face cards (excluding the 10s), there is a 9/13 chance of drawing a numerical card and as such he will place his money on that.
Now that is acceptable if one were to view the accumulation of wealth as a gamble, but for the serious...
Trend analysis is a complex process that goes beyond trend lines, channel lines and retracements. An important aspect of this type of analysis is the identification of patterns that reinforce trends and of formations that signal the reversal of trends.
Chart formations that show the extension of trends are called continuation patterns. They consist of pauses within trends and they are generated by traders who realize some or all of their profit typically ahead of significant releases of economic data or strong technical level. These behavioral patterns translate into chart formations and tend to look like neutral moves. However, they can either slope against the original trend or, more rarely, slope in the direction of the trend...
Traders go to great lengths optimising market strategies and trading systems to obtain good profitability. Unfortunately, those profits often deteriorate substantially after factoring in order fees. This article examines the effect of various broker commissions on portfolio performance and determines the optimal investment size needed depending on broker fees. The choice of broker greatly determines if a trader survives successfully in this business or quickly gives up in frustration.
Brokers use various methods to determine their pricing structures. They are often based on either block pricing (i.e. number of stocks per trade, investment amount, trading activity) or fixed pricing, better known as flat rates (fees independent of number...
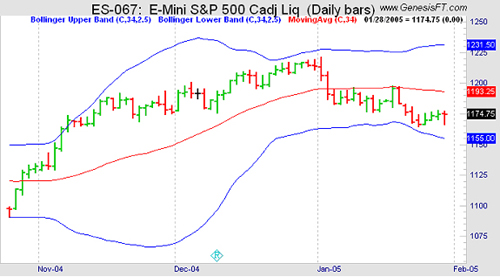
One of the great joys of having invented an analytical technique such as Bollinger Bands (see desc. below) is seeing what other people do with it. While there are many ways to use Bollinger Bands, following are a few rules that serve as a good beginning point.
Bollinger Bands provide a relative definition of high and low.
</span />That relative definition can be used to compare price action and indicator action to arrive at rigorous buy and sell decisions.
Appropriate indicators can be derived from momentum, volume, sentiment, open interest, inter-market data, etc.
Volatility and trend have already been deployed in the construction of Bollinger Bands, so their use for confirmation of price action is not recommended.
The indicators...
Imagine how much money you could have made had you sold every option that you have ever purchased? While many traders boast of huge profits attained from a singe long option play, these stories are rare in comparison to those in which traders have lost some, or all, of the premium paid for an option.
In a sense, option buyers are throwing good money after bad in hunt of that one big market move that could return extraordinary profits. Given the fact that markets spend most of their time trading in a range, it is easy to see why few traders experience the abnormal returns that drew them to the markets in the first place.
A less exciting, but more fundamentally sound approach would be to attempt to profit from markets that are trading...