Xmas Project

average of high and low.

some people call them balance points.

i think most people put too much weight upon the close value. i know it has bearings on options and what have you, but generally it is just the price at a particular time of the day. highs and lows reflect the days activitiy a lot more accurately, IMHO.


FC
 
I have detected similar dramatic changes in behaviour but about 5 years ago. Everything working really well, then suddenly the bottom falls out of the system and its next to useless as it was. The danger is, that you can test something really well and have a brilliant profit but jump on board just at the moment it ceases to work. Wouldn't be the first time!
 
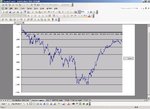
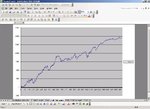
ok, here are two equity screenshots of the dax and ftse.

similar entry and exit conditions for both.

ftse seems pretty stable. dax is more wobbly than a wobbly thing.
 

Attachments

  • dax equity.jpg
    dax equity.jpg
    92.2 KB · Views: 307
  • ftse equity.jpg
    ftse equity.jpg
    84.6 KB · Views: 278
Reminds me of a system I looked at yonks ago to see what the distribution of the number of consecutive up or down days were on an index. The theory being if you got say 5 in a row the next day is more likely to go the opposite way. Didn’t work for me.
 
tried that one too tufty.


from what i have tested in the past, it is nearly impossible to predict the next day with anything more than about 55% accuracy, which just frankly isnt good enough. if you stretch the timescale to a couple of days, then things get a bit more accurate.


right, done some more testing. i hope my company realise the amount of work im putting in today.

scrap the pivot rule. only seems to work on the FTSE with any degree of reliability.

so, going back to the original rules, posted back in 1842, reversing the past few days movement seems more stable accross all the indices.

pts from 1998 are as follows

DOW 24,122 pts
Dax 9,679 pts (its a crud index anyway!!)
FTSE 24,744 (hmm, potential)
CAC 16,536
IBEX 30,593 !

anyone know what the smallest spreads are on the IBEX? :)
 
FetteredChinos said:
anyone know what the smallest spreads are on the IBEX?
The IBEX, in spite of being included in ProRealTime indices, is not a tradable instrument (i.e.CapSpreads don't do it).
 
FetteredChinos said:
average of high and low.
[...]
i think most people put too much weight upon the close value.
:eek:

So closing at the low, 100pts away from the high, wouldn't give you any extra information....?
 
nah, only that the next day is going to be bullish after an early dip. :)

i thought you had read taylor ;)
 
FetteredChinos said:
indicator? whats one of those?

what do you suggest then to filter the trades out then? surely if we get in late on a counter-trend system then most of the move will have gone?


incidentally, i have modified the existing method, employing the same method accross the indices.

looks to have boosted the results by about 25%.

will post sheet in a bit.

FC

I would go with 8 period CCI on 5 min charts so one can see couple of examples of divergences at reversal points per day . If you look on recent chart of DJI,SPX or QQQ you will see many examples of it .
 
why 8 period? why not 25? why not 3?

also, why choose CCI. how about stochs, RSI or MACD?

all of them work some of the time.

none of them work a decent majority of the time........


thanks for the suggestions though. i'll see if i can draw inspiration from somewhere.....:)
 
nope not tonight deary....


but that is a thought though...


hmm, probably cant post it on these boards though.

thanks sledge. i'lll do some tinkering.... :)
 
FetteredChinos said:
why 8 period? why not 25? why not 3?

also, why choose CCI. how about stochs, RSI or MACD?

all of them work some of the time.

none of them work a decent majority of the time........


thanks for the suggestions though. i'll see if i can draw inspiration from somewhere.....:)

If this project will ever move from brainstorm phase to testing phase, criteria must be selected. I have suggested 8 CCI, because it works good on 5 min US indexes, higher value CCI can be used for higher time frames and is available on any basic charting service . So if one is to practice reversals based on divergence that is the way to start .
Just pick one you like and move forward .
 
ottos said:
If this project will ever move from brainstorm phase to testing phase, criteria must be selected. I have suggested 8 CCI, because it works good on 5 min US indexes, higher value CCI can be used for higher time frames and is available on any basic charting service . So if one is to practice reversals based on divergence that is the way to start .
Just pick one you like and move forward .

Alternatively, decide how reactive you want to be to the market.
If you are prepared to use DA, then perhaps 2 or 3 signals a day, but if you are SBing, or want to only trade 1 signal a day or less, then use the appropriate number CCI, MACD etc that generates such signals. ( smaller numbers, more signals, bigger number, fewer signals ).
The latter approach may also lend itself to traders who want to trade, but also have a job.
 
trendie said:
Alternatively, decide how reactive you want to be to the market.
If you are prepared to use DA, then perhaps 2 or 3 signals a day, but if you are SBing, or want to only trade 1 signal a day or less, then use the appropriate number CCI, MACD etc that generates such signals. ( smaller numbers, more signals, bigger number, fewer signals ).
The latter approach may also lend itself to traders who want to trade, but also have a job.

Agree 100%,
Smaller time frames are to be used for training purposes only by those who want to trade part time .
 
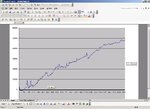
something quite astonishing...

more details to follow in a bit.


notice the number of points. notice the number of trades.


this is on the FTSE...... :) no stops at the moment. just wanted to see if the basic idea worked..


might need a fairly large trading pot though.
 

Attachments

  • beats buy and hold!.jpg
    beats buy and hold!.jpg
    81.2 KB · Views: 314
Top