New day = New Brain 🙂
Back to the start 🙂
I "ll have a stab at it again, last post was a bit brief but it was a working day when I posted and its raining here so ~
My thought........sssssssss 🙂
Just noticed that quite a few posts including mine have started to manage Jons position which was not really the point in the exercise, just goes to show where the brain wants to focus when paper money is on the line 🙂
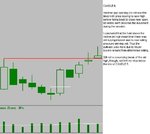
1st thing that came in to my mind when I saw Jon"s chart in post one ~
The instrument ( Bull Candle 1 ) is in new higher ground and Jon"s entry Bull candle failed to make a new high that day so perhaps not a young move = I don"t like the look of that
Where is the instrument ?
think we have a number of demand ranges lower 🙂 see told you I had been paying attention 🙂
The move looks a bit tired and no volume on the last bar = no pro money supporting higher prices.
Prive action will need to generate some more upside fuel I think.
Volume = do not think its a top just yet so Main High high prob not in yet
I favour the Birth of a new range
Jons trade, I would close out on the close of the last bar based on above thoughts, the volume drop off on the last bar gives me no reason to stay any longer. I expect 🙂 the spin top candle to mark what will be the new top of our range or there abouts and watch for the moment.
I am expecting 🙂 or would be looking for
1) price to fall back possibly just below all the candles shown, move will be nothing to scary then rally on obviously higher volume, I would expect the move to again run out of steam at the top of the range and repeat. = draw in new fuel / market participants into the boiler ready to be be burnt
or
2) price to move lower and test Jon"s obvious entry location = Head up = Volume increasing decreasing etc, price could give a very loud and clear message that longs are still very ok if price action confirms following the test on lower volume = to easy who wants us to no longs are still ok = eyes on volume and days range etc
Thats about all I see from the information so far
well apart from 🙂
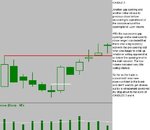
putting the last five candles together would give quite a nice candle on good volume compared to the previous Five ,
Test of high / = sellers starting to become more active volume combined looks higher on the combined re-test.
Jon"s trade ~ Changed my mind again 🙂
its a good game this, you invent it Jon ? ~
Volume does not or I do not think it looks like a top just yet so ~
Stop to BE + cost = freeplay 🙂 = always a good position for a numpty who can"t make his mind up Wot"s going to happen next 😆
= if test bar thought plays out = pro money still supporting the move, they would be more aggresive in the down bar otherwise. They want a numpty like me still in for the moment, infact they want every numpty still in. Do not want to cause a rush for the exits just yet.
A nice easy to spot test bar on low volume will keep the higher low still in play and be very visable to many this could attract the new fuel / new market participants required to propel price higher. They perhaps missed the inicial break (Jon"s Bar) and jump at the chance (greed) not wishing to miss out = a rush to buy the following day
We could then see a fast upside move before everyone gets bored and starts to wander off = supply starts to increase at these levels. This would or could be a real pain for the pro"s who want to get price higher before they start to off load their or some of their stock perhaps at much higher levels.
Good weekend all
Andy
Watching with interest, good thread again Jon 🙂
Just read this post back to myself and Bl...dy glad the trades at BE
volume on 3rd candle back is starting to bother me, its pretty high and its narrow spread is bearish
Next two candles are narrow ranges and closing on their lows, small gap ups are bear"ish also
do not like above at all, played with the idea of moving Stop up close this am and in fact posted and deleted
🙂
decided to leave it at BE + cost + a Kit Kat for me and wait for test and check volume etc
Thoughts
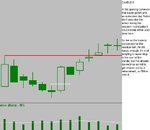
pro"s short some
numpty stops get hit, volume picks up to the downside (retail shorts)
price action takes out the stops under the whole range
pro"s step in and buy back aggressive and absorb any supply at the lower levels and reverse price back up (pinbar"ish)
long term players are kept happy when they see the quick reverse
some shorts are trapped wrong side
numpties who had their stops hit and realise their error re-enter market Long
range in place so other traders enter market Long
silly shorts are forced to cover as price advances
Activity generates fuel =
price runs up volume up into the highs = real breakout when the remaining early shorts who entered at the numpty stop area start to cover also
Morning Gap ~ Gone
Decided to leave it at BE + cost + a Kit Kat for me(Jon"s money 🙂) and wait for test and check volume
Andy