gold is an emotional commodity,the emotion ,panic, is temporarily absent,if this bigger market goes up forget gold,if the bottom scenario comes back then trade it,in the meantime hang your laundry on the clothes line and don't take the nieghbors gossip too seriously...it's jewelry
You are using an out of date browser. It may not display this or other websites correctly.
You should upgrade or use an alternative browser.
You should upgrade or use an alternative browser.
A window on Gold? Keep peering thru the looking Glass
- Thread starter The Baptist
- Start date
- Watchers 5
andycan
Established member
- Messages
- 630
- Likes
- 28
not too sure on the 2 to 3yr certainly possible im bearish as it stands though a pop here for a couple of days is not out of the question but still more down as i see it we have waterfall effect on the daily those are hard to measure the only safe trade is a break out at this juncture or if you look to fine tune look at the 60 dont be surprised if it pops to 588 thats a minimum maybe more at a stretch 595 ish that gap should act as a magnet was short yesterday but covered too early will trade it as i see it strictly a scalpers market from my perspective until it break the swing low (or high unlikely as it stands)
PS Hook Shot thanks for your comments i enjoy discussing markets its great to get different opinions
PS Hook Shot thanks for your comments i enjoy discussing markets its great to get different opinions
andycan
Established member
- Messages
- 630
- Likes
- 28
ammo
all markets are emotional more so commodities because of the nature of who trades them the commercials hedge and the funds speculate and in the middle the traders this creates a time bomb from time to time. great when you are with the trend not so when you are against it
all markets are emotional more so commodities because of the nature of who trades them the commercials hedge and the funds speculate and in the middle the traders this creates a time bomb from time to time. great when you are with the trend not so when you are against it
andycan
Established member
- Messages
- 630
- Likes
- 28
gugaplex said:Gold going down the pooper today. Below $560, chart does not look too encouraging.
i have an initial target below $500 after that will need to re evaluate
nice sweet short in gold i thought we could pop but once it broke out well just PRECIOUS!!!
The Baptist
Established member
- Messages
- 715
- Likes
- 45
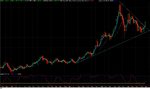
Reverse polarity classically illustrated
Hi,
Whoopee! a number of Sell stops activated and in the money over the last few days, the buy Ones looking like they not be seen again for awhile.
The Chart continues to look like a wedge rather than a symmetrical triangle, ie bearish.
The seam of windows once broken as shown by the purple elipses on the chart turned into resistance at the '3' High point. Gold failed to clear the resistance band at the '3' point and fell away after its failure dramatically.
The price gapped down showing strong selling the key next levels to continue to affirm this weak market is the $576 - $574 level. ie the '2' and '1' leg lows.
At present I can't see the above levels not being breached given the momentum the last downswing to the '2' low was equally brisk and took out a three time supported level.
The other thing to bear in mind is Brents/Crudes fall away, which in chart terms look continually weak, provides for the perception that this will relieve a lot of the inflationary pressure and hence need for Gold Both these two also possibly ties in with weak anticipated US growth as being negative fundamentals for the precious stuff.
PS as these charts are Continous contracts charts the values correlate to near term contract as opposed to Cash.
I have posted Gold and Brent (weekly) Note the tweezer Top and evening star on brent which was at the last high circled.
Attachments
The Baptist
Established member
- Messages
- 715
- Likes
- 45
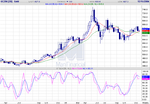
Gold Chart
attached the Gold chart.
You will notice how the price jumped over the collection of historical window support and resistance areas and has fallen just short of another level of such resistance all highlighted by the Dotted horozontal lines.
Can the momentum take it through the next resistance zone and even passed the primary seam of S&R shown by the solid lines in Black around the $602 -615 level? Stochastic positive for now.
Attachments
andycan
Established member
- Messages
- 630
- Likes
- 28
analysing gold looks to me we have a pop to the 610 area as a min (gold continues) that equates to 615 December basis
then we should continue the decline to the 508 area give or take(continues chart) which equates to 503 dec basis
thats all subject to being able to break the 603 dec basis
then we should continue the decline to the 508 area give or take(continues chart) which equates to 503 dec basis
thats all subject to being able to break the 603 dec basis
Mister Can
We are now nearing your first hurdle and are within previously mentioned 30d cycle range - Sep low was 15/9 .......which gives 15th Oct Sunday. So Tues makes 32 but some cycles in summer did stretch to 33.
First drive down off May high was 33d
We then rallied to form lower top - also ~33d
Since Sep 15 ~ 60d after lower top - 17/7/06..........Oct 15th was 90d from lower top adding more significance -perhaps...?
Take away is that we are at potential time resistance along with your potential price rez....... although Bill Mclaren has inferred that failure to give back Friday's spike reduces negative connotations....
We are also at trendline rez from May 12 highs around the 601 zone (Dec)..........i.e we might not reach the safer 615/620 short zone.
Decision Time draws near as we are now finely balanced - imo!
Hook Shot
The Baptist
Established member
- Messages
- 715
- Likes
- 45
Gold making the final 'Baptist Flag 3 Point High' ?
Gold has been strong.
If it turns down before taking out its second relative high at the 675-680 level (17th July) as most would expect.
Then bottoms before the last lows at the $557 - $570 level ( 5th October) we could be setting up for a big move BO to the upside which in all likelihood will take out the last extreme high of $730.
The easiest way to view this pattern is on a Weekly chart which I will post later.
The Baptist
Established member
- Messages
- 715
- Likes
- 45
Good chart TWI, you beat me to it.
The Baptist
Established member
- Messages
- 715
- Likes
- 45
Rh3?
Could the intraday high just sub $630 be the relative High point no 3? On the chart I had placed a blue box yesterday on the chart just above yesterdays levels, higlighting the depth of resistance levels set by previous windows, it appear the price action may have faultered here for now.
If so look for bottoming for the 3rd relative low position above the $560 level.
The long standing window ledge running through this whole pattern (which has been 3 - 4 months in the setting up) could finally prove the stabilizing point before a break out to the upside.
So my best guess range bet for a low point before building a base and breaking out would be $594 - $615.
Pattern failure at $563 levels place of RH2. (The point where a trader must accept they are wrong)
I am keenly watching Gold I think the next few weeks will be lock and load time, pre-move. Else game will be up for this pattern.
Enjoy and keep 'em peeled over the next month. Good Luck.
See Chart for detail
The Baptist said:Gold has been strong.
If it turns down before taking out its second relative high at the 675-680 level (17th July) as most would expect.
Then bottoms before the last lows at the $557 - $570 level ( 5th October) we could be setting up for a big move BO to the upside which in all likelihood will take out the last extreme high of $730.
The easiest way to view this pattern is on a Weekly chart which I will post later.
Could the intraday high just sub $630 be the relative High point no 3? On the chart I had placed a blue box yesterday on the chart just above yesterdays levels, higlighting the depth of resistance levels set by previous windows, it appear the price action may have faultered here for now.
If so look for bottoming for the 3rd relative low position above the $560 level.
The long standing window ledge running through this whole pattern (which has been 3 - 4 months in the setting up) could finally prove the stabilizing point before a break out to the upside.
So my best guess range bet for a low point before building a base and breaking out would be $594 - $615.
Pattern failure at $563 levels place of RH2. (The point where a trader must accept they are wrong)
I am keenly watching Gold I think the next few weeks will be lock and load time, pre-move. Else game will be up for this pattern.
Enjoy and keep 'em peeled over the next month. Good Luck.
See Chart for detail
The Baptist
Established member
- Messages
- 715
- Likes
- 45
The Baptist said:Hi,
It appears support has started to come in before the lows of June.
A couple of rising hammers, i am fancing Gold for a little upside.
Will try get charts up tomorrow.
Just come back to the Gold boards after a long break.
The Post above 'Sniff of Bull' was more 'Bull on', than Bull Sh*t, As the range for that day was $572 -$587, forgive the self congratulatory tone as we sit at $636, it is more the primer for what next.
I believe we will make a top soonish and a have a downleg though not as low as previously.
Longer run I still anticipate the set up for a substantial upside BO.
The Baptist
Established member
- Messages
- 715
- Likes
- 45
The Baptist said:Just come back to the Gold boards after a long break.
The Post above 'Sniff of Bull' was more 'Bull on', than Bull Sh*t, As the range for that day was $572 -$587, forgive the self congratulatory tone as we sit at $636, it is more the primer for what next.
I believe we will make a top soonish and a have a downleg though not as low as previously.
Longer run I still anticipate the set up for a substantial upside BO.
Was the High at 650 the final highpoint for the upleg.
It is possible we have the begining of a downleg at the $629 level.
The chart I have attached has a Bearish highlevel Stochastic crossing plus two near term MA's cutting the price action.
Chart should support before $580 and definetly $560 for the pattern to hold. It may not go so far as USD weakness lends support.
Attachments
The Baptist
Established member
- Messages
- 715
- Likes
- 45
Downleg confirmed
Now that we have a confirmed downleg. How far will it go I do not believe it will go much below $600 if at all given the previous support levels at $560 & $580.
What do you think?
The Baptist said:Was the High at 650 the final highpoint for the upleg.
It is possible we have the begining of a downleg at the $629 level.
The chart I have attached has a Bearish highlevel Stochastic crossing plus two near term MA's cutting the price action.
Chart should support before $580 and definetly $560 for the pattern to hold. It may not go so far as USD weakness lends support.
Now that we have a confirmed downleg. How far will it go I do not believe it will go much below $600 if at all given the previous support levels at $560 & $580.
What do you think?
The Baptist said:Now that we have a confirmed downleg. How far will it go I do not believe it will go much below $600 if at all given the previous support levels at $560 & $580.
What do you think?
Don't have much data to back-up my prediction other than I think the speculative pressure on the dollar is nearly over and inflation is moderating. Gold would have to convincingly pass through $640-650 area to be bullish. I say we bounce off $600 and then another big drop after the bounce wanes...
The Baptist
Established member
- Messages
- 715
- Likes
- 45
gugaplex said:Don't have much data to back-up my prediction other than I think the speculative pressure on the dollar is nearly over and inflation is moderating. Gold would have to convincingly pass through $640-650 area to be bullish. I say we bounce off $600 and then another big drop after the bounce wanes...
Still quiet possible, a flat based triangle formation as we have on the weekly chart gold chart is not as strong as say a symetrical triangle, technically meaning the possibility of a break through the 'floor' remains a threat to Gold Bulls. Bulls should Keep their Buystops at the last relative high i.e. $650 level to avoid losses on a fall through the fall.
Shorts should hammer the Goldie if it takes out last relative low, the day of truth on this pattern comes nearer.($558 level)
Similar threads
- Replies
- 0
- Views
- 2K
- Replies
- 0
- Views
- 2K
- Replies
- 11
- Views
- 12K