morpheustrading
Active member
- Messages
- 166
- Likes
- 3
After just a one-day bounce off its lows on November 1, the Nasdaq 100 Index ($NDX) plunged right back down to pivotal, long-term support of its 200-day moving average just one day later. Why is the Nasdaq displaying such relative weakness to the rest of the major indices? Blame it in no small part on the persistent bearishness and downright ugly chart pattern of Apple ($AAPL), a former market leader and heavily-weighted stock within the Nasdaq 100 Index.
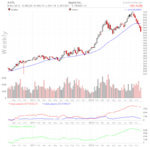
Last Friday (November 2), AAPL sliced through crucial support of its 200-day moving average for the first time since June of 2011. Now, AAPL is also in danger of losing horizontal price support of its prior “swing low” from July of 2012. If it does, it will become the first convincing “lower low” that AAPL has formed in years. As an example of just how negative recent price action has been, notice on the annotated chart below that AAPL plunged 3.3% last Friday, well below its recent low, even though the main stock market indexes still retained a portion of their previous day’s gains. AAPL has become a clear example of a stock exhibiting bearish divergence and relative weakness to the broad market:

Although our bearish analysis will undoubtedly anger the loyal army of Apple fanboys, we are merely being objective by saying that recent price action of AAPL (and quite a few other former market leaders) indicates a changing of the guards is on the horizon. However, the big problem is the replacement guards have not yet arrived. Until new leadership stocks start popping up, there will likely be no impetus for a sustainable broad-based rally. Therefore, if you've been holding AAPL for a while, did not sell on the breakdown, and are still holding out hope that the stock will recover, be warned that you are playing a very dangerous game. We personally view any substantial bounce in the stock as a chance to sell into strength and/or initiate a new short position, as the technical are indicating further downside to come.
The broad-based decline of November 2 put the overall stock market in a rather precarious position. Specifically, each of the major indices will now kick off the week following the formation of a bearish engulfing candlestick pattern. This chart pattern forms when an index or stock opens above the previous day's high, but sells off to close all the way below the previous day's low. This bearish pattern can be clearly seen on the daily chart of PowerShares QQQ Trust ($QQQ), a popular ETF proxy for trading the Nasdaq 100 Index:

As we’ve mentioned several times over the past two weeks, we’ve been monitoring both PowerShares QQQ Trust ($QQQ) for potential short sale entry on a significant rally into resistance. However, the major weakness of November 2 already sent QQQ right back down to near its recent lows. As such, there simply is not a positive reward-risk ratio for selling short this ETF at this time. Nevertheless, we are now targeting ProShares UltraShort Real Estate ETF ($SRS), an inversely correlated “short ETF,” for potential swing trade buy entry going into today. Detailed trigger, stop, and target prices were already provided to newsletter subscribers.
As for the bullish ETFs, a handful of Emerging Markets ETFs continue to hold up well and show relative strength. But as the November 2 price action demonstrated, the broad market simply remains much too weak to attempt any bullish entries right now because current breakout attempts, even in stocks and ETFs with decent relative strength, have a high likelihood of failure. This is typical of overall price action when our stock market timing model is in “sell” mode.
Last Friday (November 2), AAPL sliced through crucial support of its 200-day moving average for the first time since June of 2011. Now, AAPL is also in danger of losing horizontal price support of its prior “swing low” from July of 2012. If it does, it will become the first convincing “lower low” that AAPL has formed in years. As an example of just how negative recent price action has been, notice on the annotated chart below that AAPL plunged 3.3% last Friday, well below its recent low, even though the main stock market indexes still retained a portion of their previous day’s gains. AAPL has become a clear example of a stock exhibiting bearish divergence and relative weakness to the broad market:
Although our bearish analysis will undoubtedly anger the loyal army of Apple fanboys, we are merely being objective by saying that recent price action of AAPL (and quite a few other former market leaders) indicates a changing of the guards is on the horizon. However, the big problem is the replacement guards have not yet arrived. Until new leadership stocks start popping up, there will likely be no impetus for a sustainable broad-based rally. Therefore, if you've been holding AAPL for a while, did not sell on the breakdown, and are still holding out hope that the stock will recover, be warned that you are playing a very dangerous game. We personally view any substantial bounce in the stock as a chance to sell into strength and/or initiate a new short position, as the technical are indicating further downside to come.
The broad-based decline of November 2 put the overall stock market in a rather precarious position. Specifically, each of the major indices will now kick off the week following the formation of a bearish engulfing candlestick pattern. This chart pattern forms when an index or stock opens above the previous day's high, but sells off to close all the way below the previous day's low. This bearish pattern can be clearly seen on the daily chart of PowerShares QQQ Trust ($QQQ), a popular ETF proxy for trading the Nasdaq 100 Index:
As we’ve mentioned several times over the past two weeks, we’ve been monitoring both PowerShares QQQ Trust ($QQQ) for potential short sale entry on a significant rally into resistance. However, the major weakness of November 2 already sent QQQ right back down to near its recent lows. As such, there simply is not a positive reward-risk ratio for selling short this ETF at this time. Nevertheless, we are now targeting ProShares UltraShort Real Estate ETF ($SRS), an inversely correlated “short ETF,” for potential swing trade buy entry going into today. Detailed trigger, stop, and target prices were already provided to newsletter subscribers.
As for the bullish ETFs, a handful of Emerging Markets ETFs continue to hold up well and show relative strength. But as the November 2 price action demonstrated, the broad market simply remains much too weak to attempt any bullish entries right now because current breakout attempts, even in stocks and ETFs with decent relative strength, have a high likelihood of failure. This is typical of overall price action when our stock market timing model is in “sell” mode.