I've come to the conclusion that these threads on indicators are overly simplistic. One really needs to take a step back and ask oneself what information is available to base trading decisions on.
As I see it in equities and stock index futures, we have
1. Price, volume, time.
2. Order flow - is volume occuring at the bid or ask. Are buyers/sellers in control of the market.
3. Depth of market - what does the order book tell us.
4. Market internals - TICK, TRIN, advance/decline and various other market breadth indicators that one can dream up.
While they are obviously interrelated, they also are independent sources of information from which to derive conclusions about likely future market behavior. Whereas any number of oscillators and any number of different types of moving averages just represent price, volume, time in a different fashion, as do standard candlestick or OHLC bar charts.
I may have missed something out - I'd certainly like to know if I have.
So how to view this information ?
1. Price/volume/time
- Oscillators for reversion to mean
- moving averages, and trendlines for trend
- pivot points because some markets respond to them. Why ? - just because they do.
- Market profile - as with pivots, I strongly suspect some markets take a lot more notice of MP levels than do others.
- Other support/resistance levels - round numbers, interesting price levels on a volume profile chart (hint - low volume levels), and some levels that are just 'obvious' from a chart.
- And the more flimsy (IMHO) stuff like fibs, Elliot wave, GANN etc.
- and others such as candlestick stuff.
Additionally, we need to decide on how to slice up our time series for charting - should bars be constant time (eg 5 min), constant tick (eg 100 trades) or constant volume ? Is there in fact any conclusive, general answer to this question ?
2. Order flow - one can stare at the time and sales but it's pretty heavy going and must be ameanable to some sort of computer analysis or at least graphical representation.
3. Order book - as for order flow. There has got to be something better than staring at the DOM all day.
4. I havn't given a lot of thought to the breadth indicators but the standard stuff is quite usefull.
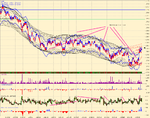
Here is a chart of todays Kospi that illustrates the point that there are more sources of info on which to make trading decisions than the standard oscillators/MAs etc etc.
It is a constant tick width chart (just 10 ticks per bar) of todays Kospi. The main price chart has bars coloured at each price level according to the rationof trades executed at the bid/executed at the ask. Take a look at the MarketDelta web site for more info on this type of thing.
The bands are constructed using multiple moving averages. Each MA is lagged by half the period of the MA (because SMAs lag by half the period) and then forecast to the current bar simply by extending a linear regression line through the last 3 bars of the lagged MA. The blue channel is then constructed by taking the mean of the LR forecasts. The idea is derived from Hurst's book.
The columndelta subchart shows the difference between the volume at bid and volume at ask for the bar.
The EhlersFIR (ColumnDelta) is a fast smoother applied to ColumnDelta.
The OrderBook delta subchart is possibly the most interesting thing here. It shows the ratio of contracts offered (ie volume at ASK) to the total volume in the the DOM. There clearly is some support to the proposition that 'market moves towards size' - which is in a way counter intuitive.
I hope this illustrates that there is something more to all this than the oscillators vs price and volume arguments that occur so frequently.
This chart is generated from an IB data feed. Milage will vary depending on feed.
As I see it in equities and stock index futures, we have
1. Price, volume, time.
2. Order flow - is volume occuring at the bid or ask. Are buyers/sellers in control of the market.
3. Depth of market - what does the order book tell us.
4. Market internals - TICK, TRIN, advance/decline and various other market breadth indicators that one can dream up.
While they are obviously interrelated, they also are independent sources of information from which to derive conclusions about likely future market behavior. Whereas any number of oscillators and any number of different types of moving averages just represent price, volume, time in a different fashion, as do standard candlestick or OHLC bar charts.
I may have missed something out - I'd certainly like to know if I have.
So how to view this information ?
1. Price/volume/time
- Oscillators for reversion to mean
- moving averages, and trendlines for trend
- pivot points because some markets respond to them. Why ? - just because they do.
- Market profile - as with pivots, I strongly suspect some markets take a lot more notice of MP levels than do others.
- Other support/resistance levels - round numbers, interesting price levels on a volume profile chart (hint - low volume levels), and some levels that are just 'obvious' from a chart.
- And the more flimsy (IMHO) stuff like fibs, Elliot wave, GANN etc.
- and others such as candlestick stuff.
Additionally, we need to decide on how to slice up our time series for charting - should bars be constant time (eg 5 min), constant tick (eg 100 trades) or constant volume ? Is there in fact any conclusive, general answer to this question ?
2. Order flow - one can stare at the time and sales but it's pretty heavy going and must be ameanable to some sort of computer analysis or at least graphical representation.
3. Order book - as for order flow. There has got to be something better than staring at the DOM all day.
4. I havn't given a lot of thought to the breadth indicators but the standard stuff is quite usefull.
Here is a chart of todays Kospi that illustrates the point that there are more sources of info on which to make trading decisions than the standard oscillators/MAs etc etc.
It is a constant tick width chart (just 10 ticks per bar) of todays Kospi. The main price chart has bars coloured at each price level according to the rationof trades executed at the bid/executed at the ask. Take a look at the MarketDelta web site for more info on this type of thing.
The bands are constructed using multiple moving averages. Each MA is lagged by half the period of the MA (because SMAs lag by half the period) and then forecast to the current bar simply by extending a linear regression line through the last 3 bars of the lagged MA. The blue channel is then constructed by taking the mean of the LR forecasts. The idea is derived from Hurst's book.
The columndelta subchart shows the difference between the volume at bid and volume at ask for the bar.
The EhlersFIR (ColumnDelta) is a fast smoother applied to ColumnDelta.
The OrderBook delta subchart is possibly the most interesting thing here. It shows the ratio of contracts offered (ie volume at ASK) to the total volume in the the DOM. There clearly is some support to the proposition that 'market moves towards size' - which is in a way counter intuitive.
I hope this illustrates that there is something more to all this than the oscillators vs price and volume arguments that occur so frequently.
This chart is generated from an IB data feed. Milage will vary depending on feed.