Where is the boundary between analysis and subjective conclusions?

zaysev36

Well-known member
Messages
420
Likes
15
I've been studying some analysis instruments in my free time, and it astounds me how much subjective reasoning must be present. You need to understand trend to know what method to use. But how do you define trend? Well, it's kind of fuzzy - just pick one you see fit. Using Elliott waves is useful tool, but how do you define the starting point? Meh, pretty random. Stochastic oscillator is a great tool to define if stock is oversold or overbought. But if it goes over 80, how do you decide whether you should sell the stock or keep it because it will stay ovebought for some time? You guess it... Literally.

Is it just me, or is really the case? Or is it the combo of these instruments that let you predict the market? Because so far it doesn't look all that useful to me as everyone seems to claim. :eek:
 
You can't predict the market but you can make a pretty good probility-based estimate. Yes, it is a bit fuzzy with trendlines etc - that's why successful, ie proftable trading has never been and never will, be easy. DbPhoenix's thread has some good instruction in this area. It gets easier as you go on and your comments show that you do have some realistic understanding of the situation. That bodes well.
 
In my opinion candlestick analysis is the least subjective type of technical analysis out there. The shape of the candlestick has to fit certain conditions to mean something.
 
In my opinion candlestick analysis is the least subjective type of technical analysis out there. The shape of the candlestick has to fit certain conditions to mean something.

Hm, I haven't got to this part of analysis yet. Where can I read about it? Could you provide some links or something? Or just general direction where should I start :smart:
 
TA is only a tool and nothing more.... you can also get lost in it if you try harder....market cannot be defined....charlatans can.......trading is about probability......market might turn at some level but also can turn at not level......

TA is an art form, is subjective, it can be useful when combined with a style that reflects your personality.......it might take many years before you can combine the two....

Trading TA in his pure form can be a losing game imo, but using TA as a tool to trade traders can be the way.

How do you define a trend? You cannot in a classical way, it is all clear after the fact....but trading is in the now.

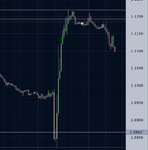
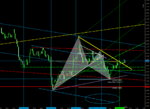
I went short EU here, was it against the trend? For most it was but not for me, traders were taking profits and I went along.....with the trend.
 

Attachments

  • eu.png
    eu.png
    18.3 KB · Views: 191
I've been studying some analysis instruments in my free time, and it astounds me how much subjective reasoning must be present. You need to understand trend to know what method to use. But how do you define trend? Well, it's kind of fuzzy - just pick one you see fit. Using Elliott waves is useful tool, but how do you define the starting point? Meh, pretty random. Stochastic oscillator is a great tool to define if stock is oversold or overbought. But if it goes over 80, how do you decide whether you should sell the stock or keep it because it will stay ovebought for some time? You guess it... Literally.

Is it just me, or is really the case? Or is it the combo of these instruments that let you predict the market? Because so far it doesn't look all that useful to me as everyone seems to claim. :eek:
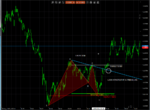
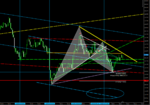
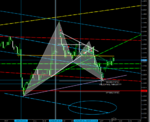
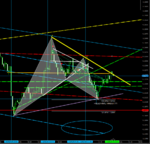
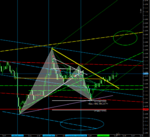
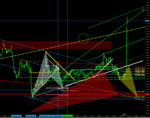
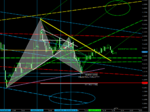
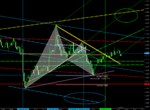
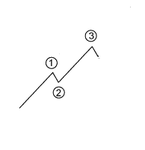
for ew i think starting from the small timeframes up is the way to do it. for me, the scenario of 3 of 3 of 3 has the best probability and its the only one that pops out for me.
i dont use stocs as for me it seems when people sell on those conditions, their hand is easily seen and their stops get trashed. at least that was my early experience. the most consistent thing i see that astonishes me is market geometry and the power of support and resistance. sorry about the messy charts.
 

Attachments

  • rr1.PNG
    rr1.PNG
    82.6 KB · Views: 236
  • E16AC.PNG
    E16AC.PNG
    157.1 KB · Views: 207
  • E16FALHAM.PNG
    E16FALHAM.PNG
    129.3 KB · Views: 226
  • E16TW.PNG
    E16TW.PNG
    134.8 KB · Views: 210
  • E17.PNG
    E17.PNG
    159.8 KB · Views: 188
  • E24DOUB.PNG
    E24DOUB.PNG
    228.6 KB · Views: 194
  • E18.PNG
    E18.PNG
    147.8 KB · Views: 181
  • E17PF.PNG
    E17PF.PNG
    190.5 KB · Views: 179
  • E17BUY.PNG
    E17BUY.PNG
    156 KB · Views: 231
  • e24prof.PNG
    e24prof.PNG
    160.4 KB · Views: 201
  • e25.PNG
    e25.PNG
    243.6 KB · Views: 209
  • e26.PNG
    e26.PNG
    197.2 KB · Views: 193
. . . Is it just me, or is really the case? Or is it the combo of these instruments that let you predict the market? Because so far it doesn't look all that useful to me as everyone seems to claim. :eek:
Hi zaysev36,
In answer to the question posed in the thread title, the boundary is defined by your trading plan. If you don't know what action to take in any given situation, then you are making an off the cuff subjective analysis - aka gambling. If your trading plan (assuming you have one) dictates that you take specific action when the stochastic hits 80 - then that's what you do. Of course, there will be times when the pre-determined action turns out to be the wrong one but, across the board, following your plan will pay dividends. Just as tennis ace Novak Djokovic doesn't win every point, or even every game, he has a habit of coming out on top in the end.

You've reached the conclusion that trend is important. In terms of how you define it - that's up to you. You could use a series of moving averages as described in the The 3 Duck's Trading System, or using Point & Figure charts as described in learning to read price action with p/f charts or drawing straight lines as described in If You Can Draw A Straight Line (You Can Become A Successful Trader) .

Find a theoretical approach that makes sense and has a methodology you understand and can apply; then stick to it like poop to a blanket. With that in place, deciding whether or not you should sell when the stochastic (or any other indicator) is overbought becomes a whole lot easier. Not easy necessarily, just easier. From your comments, I'm guessing you don't yet have a thoroughly researched and tested trading plan in place. If so, you may find the third link in my signature helpful.
Tim.
 
for ew i think starting from the small timeframes up is the way to do it. for me, the scenario of 3 of 3 of 3 has the best probability and its the only one that pops out for me.
i dont use stocs as for me it seems when people sell on those conditions, their hand is easily seen and their stops get trashed. at least that was my early experience. the most consistent thing i see that astonishes me is market geometry and the power of support and resistance. sorry about the messy charts.

Excuse me my incompetense, but I can't grasp what you were trying to say with those charts. Could you provide some comments to them or something?
 
if you would like the complete commentary ask me. ive posted the entire narrative on a different forum
 
I'm guessing you don't yet have a thoroughly researched and tested trading plan in place. If so, you may find the third link in my signature helpful.
Tim.

Thanks, I've checked the link, it's a great article! I will definitely get to it in depth when I have some spare time. I believe it will be a nice tool to organize my image of trading :smart:
 
yes they show that lines are relevant
Hi MM,
Just looking at your first chart, I counted around 20 lines - are they really all relevant? Two or three perhaps - maybe even five - but I'm really struggling with twenty!

I would have thought there must come a point when the more lines you have that the overall picture gets confused and they start to negate one another - rather than provide confluence upon which a clear trading decision can be made. For me, that point would be around five: I favour clean and simple charts where the most dominant thing is price.

That said, if it works for you - it's not my place to criticize and goes to show there's more than one way to skin a cat.
Tim.
 
well, i have an understood relationship with each line. its all in the narrative but i dont think directing you to the site where it was posted would be in good taste!
 
Ultimately we are all tying to fit our own view of the market into defendable rules and patterns .....if the market decides it's going to do the opposite then you are going to have a bad bad day dudes

N
 
Hm, I haven't got to this part of analysis yet. Where can I read about it? Could you provide some links or something? Or just general direction where should I start :smart:

Steve Nison's books on the topic provide plenty of information, I learned from them.
 
Ultimately we are all tying to fit our own view of the market into defendable rules and patterns .....if the market decides it's going to do the opposite then you are going to have a bad bad day dudes

N

Yeah, it's part of my concern. It seems that all and each of these instruments work only as long as they work (however stupid this sounds :) ). I mean, it really looks like Barnum's effect to me. And the only real way I see to win in trading - is by having a hoard of money you can invest into different areas in order to minimize the risk.
 
The thing about technical analysis is its just a tool.

Say you need to do a task. there might be 1000 different ways to do said task. Some ways work well in one instance, but not well at other times.

A different technique might work well when the other one didn't and vice versa.

Its the same with TA. There are 1000's of profitable ways to trade. You just need to pick one and stick with it long enough, while managing risk in order to see the results.

If you keep changing, or adding different types of analysis you will end up confusing yourself with comflicting information, and you will never be able to realise the absolute edge you have over the market from executing said strategy.

A second example.

System one (analysis, tools, technique etc) might win the following.

1. Win
2. Win
3. Loss
4. Loss
5. Loss
6. Win

System 2, different tools, analysis taking the same trades might be something like this.

1. Loss
2. Loss
3. Win
4. Win
5. Win
6. Loss

If you switched from system 1 to 2 and back to one again randomly, you will most likely catch all the losers. You will never be able to pin-point what part of your trading is wrong, since you are never trading consistently.


edit: just wanted to add, this is why everybody says there is no golden rule or technique to trading which is always right, so stop searching for it.

It is human nature to want to be right all the time, after all that is what applies to everything else in your life, however its not the case in trading. You must accept that you don't always have to be right in order to make money. Just be as logic as possible about it and use a trading plan.

Make a trading plan utilising a strategy(s) and stick with it. Trail for a large number of trades, assess results, adjust plan if necessary by reviewing your trades until desired results are achieved.
 
Last edited:
Top