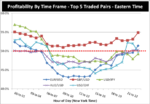
TBH I would take that chart in your 1st post with a pinch of salt.
What it is actually showing is the profitability of FXCM clients.
USD and Euro most trades currencies.
FXCM clients mostly American.
So the profitability stats are quite likely skewed by that.
Although the plot does suggest 9-10 EDT is not a great time for EURUSD, and I would agree,
that chart also seems to suggest the late asian session is the best time, which is odd to say the least.
I think what is happening here is FXCM cannon fodder volume dries up outside of
paek hours, leaving only those with a profitable swing trade method to fuel the stats.
In short, what its really showing are the times when FXCM clients are least profitable.
That is skewed whn most are present and by pair popularity.
Its not a study of volatility or range by time bracket.
Its something I've looked at myself:
http://www.trade2win.com/boards/forex/178822-eurusd-session-activity.html
Although that thread barely scratches the surface.


