What went wrong in this trade?

Shawty_

Junior member
Messages
23
Likes
2
Hello fellow traders,

I'm here today to humbly ask for your help in understanding exactly what went wrong in the following trade.

A helpful point before we get started:

- I'm learning to go long on trades and having been burnt [badly] in many prior long trades have become both extremely scarce with my long trades and also put much tighter stops on positions that go bad.

With that said, I hope you all can provide your ideas on what went wrong with the long trade below.

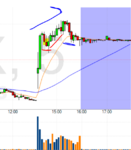
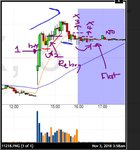
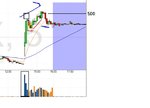
I received a "buy" signal on strong volume around 14:28 confirmed on positive news and proceeded to enter long on ACRX. The first thing I noted I did wrong was enter pretty high (I entered at the highlighted section) and should've waited for a pullback, however, when the pullback finally arrived (notice the 2 red bars going lower and lower, I was instantaneously alerted to a dump and waited another 2 minutes for a retracement that did not come, and tossed myself out of the trade at a small loss. My complete objective was to avoid larger losses.

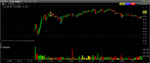
Needless to say, the retracement occurred beautifully shortly thereafter and I began to wonder if I could have traded this better than I did. I believe I could have, but with difficulty, I should've had more patience had I not seen 2 large red bars emerge before my eyes.

I know I could've done this better. Where was my mistake and what can I do differently next time?

Thank you.
 

Attachments

  • 11218.PNG
    11218.PNG
    51.8 KB · Views: 215
Shawty

It’s always easy in hindsight to see what you could have done better, so i’d Just make a couple of general points.

Firstly, full marks to you for cutting the trade a taking the small loss. That’s good discipline.

However, much depends on your method. Do you know what normally happens after a “signal” which would have had a successful outcome? Does price most times move up and away immediately, in which case an immediate pullback is a danger to you. Or is there a pullback most times before price moves up, in which case it should be catered for before a danger light comes on.
 
hey there

in trading you must settle on a solid and tradable system encompassing patterns , indicators etc etc

the more absolutely solid this process (rules etc) is with no gray areas the better .......that removes doubt from taking trading decsions and trigger pulling......

then you must trade it with 100% efficiency following the rules ........

then only sample size of trades from backtesting or indeed live forward testing will tell you if the system is successful over time ............more trades the better .....

to ask why 1 trade did not work is difficult to answer .......whatever system you have may be just unsuccessful on this occasion......there are many many variables in the mix

anyone who answers here will have their on spin on it ....... no one will be the same

i dont bother to trade volume as i am a forex trader .......so no use to me at all .........looking at raw candlesticks in this market again I have no real feel at all for where to be .........if this were a currency pair i would have much more feeling based on the Timeframe involved ........(1min vs 4h etc etc)

so I shouldnt critique something that i feel i am not really qualified to advise you on

but heres my take on it

see below .......Attack the spike breach (1) , Attack the rebuy signal on breach of first new bull bar (2) ..then keep setting prices to activate trades on further rebuy opportunities (3 and 4) which didnt happen ..........once the price flattened into nothing i would wait until the market activates again .......

but as already stated here by barjon..... depends on the market dynamics and its propensity to do these things historically

N
 

Attachments

  • signals.JPG
    signals.JPG
    43.5 KB · Views: 187
Last edited:
Learning to "go long" on trades is as good a place to start as any. However, doing so by trying your wings on a stock that makes no money, is so thinly traded, and appears to trade solely on news is not likely the best choice if you are attempting to learn a particular set of tactics within an overall strategy

Assuming that those first few bars constitute your "buy signal", how you're receiving that signal at 14:28 when these are 5m bars is not clear. Perhaps you're using an indicator of some sort. Nonetheless, defining what you mean by "buy signal" is one of your first tasks. If you like to enter on retracements, those first two red bars at 14:30 and 14:35 are your retracement. If you had entered there according to what is allegedly your plan, you need not have exited until the move is done at 15:25 (you know it's done by the volume; your volume appears to be incorrect). Ignoring these exit signals because you believe that price is going to continue to advance constitutes trading what you think, not what you see. Nonetheless, cutting your loss was essential and responsible. Evaluating what you did and why is also essential and responsible, as is considering what to do the next time. And there will be a lot of next times.

Db

PS. It's refreshing to see somebody trading a stock.
 
For those who replied,

Firstly - THANK YOU for taking the time out of your day to read this and respond with your thoughts.

I want to say I mistakenly wrote that I entered long in the highlighted section when I meant to write that I entered long around ~$3.84 and EXITED the trade in the highlighted section because (as rightfully pointed out) the red candles were 5min candles that appeared to be getting larger and I decided to exit ASAP.

I know for a fact my entry was at the high point and I should've waited for a pullback, and I digressed as a result of the trade alert, which was a very wrong thing to do (lesson learned). I saw the volume skyrocket and entered based on minor 1min pullbacks. Again, seeing 5min red candles getting lower and larger alerted me to an impending reversal and I had to exit immediately.

However, the volume was mentioned in the last comment - can you elaborate? Perhaps, you can briefly walk me through which point in the trade I ignored/or should have paid more attention to? Thanks again to all!
 
It has been a long time a decent thread has been started with a question that can help all traders.

You have to be careful not just to snap shot and zoom in too close to the action. As you have done so with this. The volume is vital, but without a bigger context you can make no informed decision as to the importance of the level of volume.

This was BIG volume, take a look at the whole year so far! But as you have no price either you cant make a call on what traders are doing here off the news. 5.00 is just above, this level has been reached into and sold hard by smart money - but guess who is chasing and going long????

The move at your time of entry is pretty much done. The failed break out confirms this.

Taking a trade where you did is too risky, and the odds are not in your favour. Yes, a few now and again will carry on, but most will stall, then flat line then drop back. Not worth the risk!

There is no need to go deeper with this scenario.

Price and volume tell you to STAY AWAY
 

Attachments

  • acrx.jpg
    acrx.jpg
    64.4 KB · Views: 162
I want to say I mistakenly wrote that I entered long in the highlighted section when I meant to write that I entered long around ~$3.84 and EXITED the trade in the highlighted section because (as rightfully pointed out) the red candles were 5min candles that appeared to be getting larger and I decided to exit ASAP.

I know for a fact my entry was at the high point and I should've waited for a pullback, and I digressed as a result of the trade alert, which was a very wrong thing to do (lesson learned). I saw the volume skyrocket and entered based on minor 1min pullbacks. Again, seeing 5min red candles getting lower and larger alerted me to an impending reversal and I had to exit immediately.

However, the volume was mentioned in the last comment - can you elaborate? Perhaps, you can briefly walk me through which point in the trade I ignored/or should have paid more attention to? Thanks again to all!

When you say that you entered "around" 3.84, that implies a market order. Even so, you could not have done so since last Wednesday as price left that area and never returned to it. Be that as it may, a stock which is so thinly traded presents its own risks as I mentioned. But it's your money.

As for which points in the trade you ignored or should have paid more attention to, you are unclear as to exactly what it was you were looking at. You're concerned about "5m red candles" but you entered based on "1m pullbacks". If you were looking at a 1m chart, you would have seen that the move was not an uninterrupted 15m rise ending in a double top and that your first retracement is at 14:17, not 14:25. What happens using a 5m interval isn't relevant as you can't trade what you can't see. Keep in mind that price movement is continuous, and that switching back and forth among 1m and 5m and 3m and 15m and so on is chiefly a matter of zooming in and out. If you're zoomed out, you're going to miss a lot of what traders are doing, and if you're daytrading, you can't afford to do that.

As for volume, remember that volume is made up of both buying and selling. If buyers have no sellers to buy from, there's no trade. Therefore, your reaction to loads of volume in a rising price should not be limited to what you see as lots of buying but should include also all the selling that's going on at the same time. Who's selling? Chiefly those who bought earlier and initiated the rise in the first place. Once they're out, then it remains to be seen whether other buyers will pick up the slack and propel price higher or if that initial thrust was all there was to it and anyone who buys afterward is left holding the bag. This is what retracements are all about, and if the trader doesn't understand how all this works, his "retracement" is at risk of becoming a reversal.

In this particular instance, note that volume is lower at 14:17 than it was at 14:15. If sellers were desperate to unload what they had, volume would more likely be higher, assuming that sellers could find buyers to take their holdings off their hands. But a further clue lies in what price does at that point, rallying from a low of 4.15 during that interval. Price then rises with no interruption on generally subsiding volume, telling you that selling pressure is slackening and buyers can push price higher with little interference. Eventually, demand slackens off, and price enters a period of stasis, or equilibrium, where it will remain until somebody decides to assume the risk of stepping up to the plate and moving price one way or the other.

Volume is more than a bar; it is a measure of trading activity, or interest. Price movement tells you where that interest lies, to the upside or the down. If there's little interest, as there was before this news announcement, then there's piddling volume and little price movement. Characterizing the volume as "up" or "down", particularly if you're confusing the issue with colored bars, is a waste of time and energy. It is the movement of price that tells you whether buying pressure or selling pressure is the greater.

Db
 
When you say that you entered "around" 3.84, that implies a market order. Even so, you could not have done so since last Wednesday as price left that area and never returned to it. Be that as it may, a stock which is so thinly traded presents its own risks as I mentioned. But it's your money.


Db

Yeah I saw that too - I think Shawty means $4.84? not $3.84.

To be honest, re-reading, none of this makes sense ie "3.84 being high in the market"?????

It is very hard to help with so many inaccuracies.

Shawty - it is better just to bring up a 1 min chart and mark on your entry. Then mark on your exit.

Can you do that?

Then it will become clear.

Danke
 
Last edited:
Hi All,

Yes, I meant $4.84, and the reason I estimated is because I set a limit order for $4.84 - meaning I had a few $4.83s as well. I apologize; I've been writing these responses at night and have allowed a few important typos to occur.

For the 1min chart please see the attachment. I entered at ~4.84 (yellow brackets) and exited at 4.72 (neon blue brackets) with a market order because I didn't know if the stock would be dumped. Seeing the red bars continue and get larger I was worried it would just hit rock bottom and I was done. I see the lowest point of the pump was around $4.15 - and I was not about to allow my position to reach that point. It boggles my mind. The reversal occurs 1 minute after I exited. I could have waited, but you never know what's going to happen.

Per usual, I appreciate your responses. Please continue offering your thoughts if you so choose.
 

Attachments

  • Trade 11.4.18.PNG
    Trade 11.4.18.PNG
    48 KB · Views: 187
Hi All,

Yes, I meant $4.84, and the reason I estimated is because I set a limit order for $4.84 - meaning I had a few $4.83s as well. I apologize; I've been writing these responses at night and have allowed a few important typos to occur.

For the 1min chart please see the attachment. I entered at ~4.84 (yellow brackets) and exited at 4.72 (neon blue brackets) with a market order because I didn't know if the stock would be dumped. Seeing the red bars continue and get larger I was worried it would just hit rock bottom and I was done. I see the lowest point of the pump was around $4.15 - and I was not about to allow my position to reach that point. It boggles my mind. The reversal occurs 1 minute after I exited. I could have waited, but you never know what's going to happen.

Per usual, I appreciate your responses. Please continue offering your thoughts if you so choose.


That's more like it Shawty!

Nothing to add to my previous post, you are buying in a very vulnerable area, where a massive amount of business has been done in the run up to $5, so only scraps left to fight for in a very thinly traded stock.

G/L with the next trade!
 
Top