The end of 2007 was characterized by extreme values in various indicators of stock market analysis. In this article I will review and analyze four of them. I will use the term "indicator" here not necessarily according to the technical analysis jargon but rather as a set of clues (either measurable or not) under the same idea which can reveal specific internals of the stock market and imply bullish or bearish projections.
The First Indicator: Commercials Versus Small Speculators
The Commodity Futures Trading Commission releases weekly information known as Commitment of Traders (or simply COT) report about various markets which can be used to approximate the net open interest for futures and options in each of the following three categories of market participants: Commercial Hedgers, Large Speculators and Small Speculators. The commercial hedgers (or simply commercials) are those who use the markets for hedging while the speculators are those who try to profit from the market itself. The discrimination between large and small speculators is based on their average trading volume. Among the three categories the information regarding the commercials and the small speculators are the most important. As a rule of thumb, the commercials are usually right and the small speculators are usually wrong. There is a plain explanation for this: On the one hand, the small speculators include the "uninformed public" which is trying to accumulate wealth in a very short period from the market swings and on the other, the commercials are hedgers who use the markets to reduce risk and make money in their businesses. The latter group consists of those who know their business inside out. A useful book dedicated to the COT reports is Larry Williams' "Trade Stocks and Commodities With the Insiders" ([4]).
Two things must be stressed with respect to commercials' behavior in the markets. The first is that even though the net position of the commercials is quite informative, the fact that they do not attempt to profit from the market swings makes them more sellers than buyers. It is generally unusual seeing them being net long for a market for a prolonged period. In effect, we are interested mainly in extreme readings of the commercials' net interest relative to the past. The second is that the reflections of the commercials are those of a giant dinosaur. They change their positions gradually and usually much earlier than the actual market turn. Bearing this in mind, take a look at figure 1 where the recent activity of commercials and small speculators for futures and options on SP500 is illustrated.
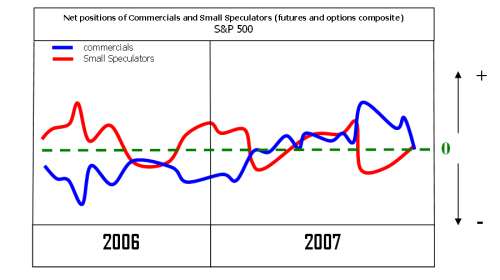
It is apparent that during the last quarter of 2007 the commercials and small speculators had completely different opinion about the future prospects of the stock market. It is interesting that not only the commercials were net long but also they had the largest multi-year net position (not shown in the chart). This is clearly one of the most bullish signals one can get from the study of the COT report but there is more.
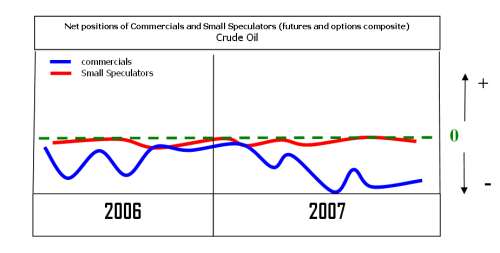
In figure 2 you can see a similar chart this time showing the net open interest of commercials and small speculators for crude oil. Higher prices of crude oil are generally viewed as inflationary and thus have a negative impact on the stock market. It was mentioned before that the commercials are generally sellers thus usually having negative net positions and this was the case for the crude oil for 2006 and 2007. Bearing this in mind it is the extreme cases or deviations from this behavior that raises the alarm that something is going on. Notice that though crude oil is in a strong uptrend during the last months of 2007, the commercials have taken a very negative net position which can be seen as a bearish forewarning for its price and a positive indication for the stock market in the long run. It is not the negative net position of commercials that produce the bearish sign for crude oil but rather the magnitude of their position in relation to their position for the past 2 years. The information from figure 2 alone is not sufficient to conclude meaningful opinions but when seen in conjunction with the chart from figure 1 the conclusions are plain as the day.
The Second Indicator: Aggregate Activity of the Insiders
Insiders are defined as officers and directors having decision-making authority as well as owners of more than 10% of any equity class of securities. Insiders are required to report to the Securities and Exchange Commission all of their buying/selling activity at specified times following their transaction. It is obvious that monitoring the stock purchasing or selling clusters of the people who work at the company (and specifically of the people who are in the driver's seat) gives significant clues about the prospect of the company. In effect, monitoring the aggregate activity of insiders for all stocks gives significant clues for the whole stock market. Two things must be taken into account when examining insider activity. First, the insiders are usually sellers. Larry Williams reports in "The Right Stock At The Right Time" ([5]) that since many corporate executives are compensated with shares as well as salaries, the normal sells/buys ratio for the insiders is about 2.5 while others consider that this ratio is much greater than that. Second, insiders normally buy into price weakness and sell into price strength therefore, as George Muzea pinpoints in "The Vital Few vs The Trivial Many" ([1]), it is important to look for deviations from this behavior. Generally, insider buying during an uptrend is much more bullish than insider buying during a downtrend and selling during a downtrend is much more bearish than selling during an uptrend. Additional sophisticated concepts relative to the interpretation of insiders can be found in Muzea's book and result reports concerning the usefulness of SEC filings can be found in "Investor Intelligence from Insider Trading" by Nejat Seyhun ([3]). My research on a number of stocks shows that in terms of both quantity and quality of the difference between the aggregate insiders' buy transactions and aggregate insiders' sell transactions for the last months of 2007 were in multiyear highs and as mentioned above this is a very strong bullish sign.
The Third Indicator: Performance of Sectors
It is well known that each stock market sector has its forte at a specific time during the business and stock market cycles. This is commonly known as "The Sector Rotation Model" (SRM). Peter Navaro's book "When the Market Moves, Will You Be Ready?" ([2]) covers this subject very well and it is my recommendation for those who wish to find compact and decent information on the model. From a hardcore view of fundamental analysis, one should try to identify the current position of the economy in the business cycle, then project this position in the stock market cycle and finally identify the sectors that will likely outperform the market in the near future. A different more technically oriented view is to reverse the previous method and use the sectors performance to identify the current position in the stock market cycle. Since the SP500 index is regarded as the most reliable proxy for the US stock market one can use the SP500 sector exchange traded funds (ETFs) to accomplish the latter.
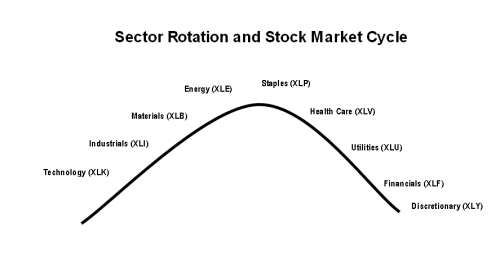
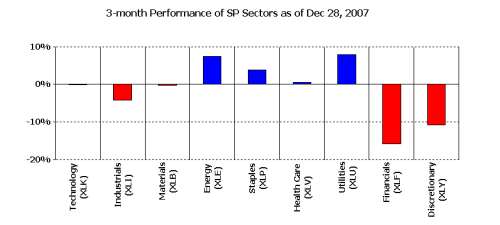
Figure 3 illustrates the sector ETFs that are likely to perform well during the various phases of the stock market cycle according to the SRM. Study figure 3 carefully and then take a look at figure 4 where the percentage change between the end of September 2007 and the end of December 2007 is shown. Now go back to figure 3 and identify the position in the stock market cycle (black curve) which should correspond to the data from figure 4. It should be readily apparent that the SRM sends bearish signs about the stock market.
The Fourth Indicator: Cash Levels of Mutal Funds
Mutual funds (MFs) are among the big players in the stock market game and their positions and intentions admittedly affect the performance of the stock market. Each month the Investment Company Institute releases information reports regarding the US mutual funds industry. Amongst the various important issues one can find in these reports is the liquid assets of MFs (also called cash levels). According to Larry Williams ([5]) when MFs are sitting on a great deal of cash on a relative basis it means they can buy and push the stock market prices higher when they have very little cash on hand it's very difficult for stock prices to go higher. This is not a new idea. It is based on a fundamental tenet of trading: "when all are on the bullish side no one is left to buy".
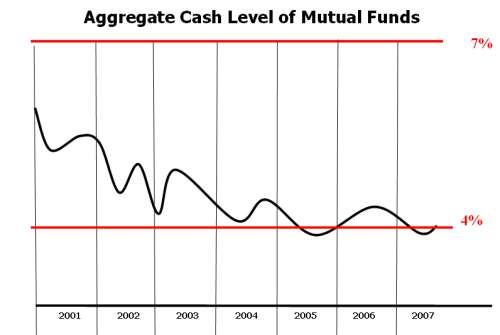
By this token, take a look at figure 5 where the aggregate raw cash levels of the MFs are shown from 2001 to the mid 2007. The figure is clearly disappointing as it shows that the MFs are heavily loaded and have the least cash on hand relative to the past.
The Raw Results
A simplistic study of commercials, insiders, sector rotation and mutual funds cash levels do not seem to produce a meaningful answer about the prospects of the stock market for 2008. The activity of commercials and insiders implies a strong market while the performance of sectors along with the mutual funds cash levels sends serious bearish signs.
A More Sophisticated Approach
While the raw study of the four indicators gives no straight answer I have the impression that a more detailed look puts more ticks in the bullish side and this is for a couple of reasons. First, the commercials and insiders are by definition those who know better and their activity must be taken more seriously into account. Their bullish attitude during the last months of 2007 is remarkably unusual and reasonable implications from this attitude have not surfaced yet. The performance of sectors on the other hand is a combination of all market participants making the third indicator a little less significant. Second, a long term falling cash level of mutual funds alone does not seem to have the strength to reverse a bullish market (take a look at the trend of the cash levels of MFs from 2003 and thereafter in figure 5). Also, the fact that the mutual funds are heavily loaded with respect to their assets does not mean that they will not have fresh cash to invest if new individuals give them their money which leads to the third reason: the massive entrance of the general public. Beginning from 2003 we have faced a remarkable bull market but in my opinion we have not yet seen a wider distribution of stocks to the general public.
In Conclusion
I tried to cover and analyze the performance of four of the most significant stock market indicators during the last months of 2007. Two of them gave bullish signals and two of them gave bearish signals for the beginning of 2008 but in terms of quality I believe the weight is more on the bullish side. In any case, all the indications require confirmation from the market and this is where technical analysis comes in. During the last months of 2007 the stock market is fluctuating trying to find a direction and the strong multiyear uptrend that started in 2003 is in serious danger. The technical signals in the broad stock market indices will give the final answers. One thing is for sure however: This unusual coexistence between extreme readings in the four indicators and its implications should be noted for future reference when similar situations emerge.
Staying Up to Date
There are subscription sites where most of the data I have presented here is available in a convenient form. You can however monitor the indicators for free on the Internet as all of the data is publicly available from official and unofficial sites.
REFERENCES
The First Indicator: Commercials Versus Small Speculators
The Commodity Futures Trading Commission releases weekly information known as Commitment of Traders (or simply COT) report about various markets which can be used to approximate the net open interest for futures and options in each of the following three categories of market participants: Commercial Hedgers, Large Speculators and Small Speculators. The commercial hedgers (or simply commercials) are those who use the markets for hedging while the speculators are those who try to profit from the market itself. The discrimination between large and small speculators is based on their average trading volume. Among the three categories the information regarding the commercials and the small speculators are the most important. As a rule of thumb, the commercials are usually right and the small speculators are usually wrong. There is a plain explanation for this: On the one hand, the small speculators include the "uninformed public" which is trying to accumulate wealth in a very short period from the market swings and on the other, the commercials are hedgers who use the markets to reduce risk and make money in their businesses. The latter group consists of those who know their business inside out. A useful book dedicated to the COT reports is Larry Williams' "Trade Stocks and Commodities With the Insiders" ([4]).
Two things must be stressed with respect to commercials' behavior in the markets. The first is that even though the net position of the commercials is quite informative, the fact that they do not attempt to profit from the market swings makes them more sellers than buyers. It is generally unusual seeing them being net long for a market for a prolonged period. In effect, we are interested mainly in extreme readings of the commercials' net interest relative to the past. The second is that the reflections of the commercials are those of a giant dinosaur. They change their positions gradually and usually much earlier than the actual market turn. Bearing this in mind, take a look at figure 1 where the recent activity of commercials and small speculators for futures and options on SP500 is illustrated.
It is apparent that during the last quarter of 2007 the commercials and small speculators had completely different opinion about the future prospects of the stock market. It is interesting that not only the commercials were net long but also they had the largest multi-year net position (not shown in the chart). This is clearly one of the most bullish signals one can get from the study of the COT report but there is more.
In figure 2 you can see a similar chart this time showing the net open interest of commercials and small speculators for crude oil. Higher prices of crude oil are generally viewed as inflationary and thus have a negative impact on the stock market. It was mentioned before that the commercials are generally sellers thus usually having negative net positions and this was the case for the crude oil for 2006 and 2007. Bearing this in mind it is the extreme cases or deviations from this behavior that raises the alarm that something is going on. Notice that though crude oil is in a strong uptrend during the last months of 2007, the commercials have taken a very negative net position which can be seen as a bearish forewarning for its price and a positive indication for the stock market in the long run. It is not the negative net position of commercials that produce the bearish sign for crude oil but rather the magnitude of their position in relation to their position for the past 2 years. The information from figure 2 alone is not sufficient to conclude meaningful opinions but when seen in conjunction with the chart from figure 1 the conclusions are plain as the day.
The Second Indicator: Aggregate Activity of the Insiders
Insiders are defined as officers and directors having decision-making authority as well as owners of more than 10% of any equity class of securities. Insiders are required to report to the Securities and Exchange Commission all of their buying/selling activity at specified times following their transaction. It is obvious that monitoring the stock purchasing or selling clusters of the people who work at the company (and specifically of the people who are in the driver's seat) gives significant clues about the prospect of the company. In effect, monitoring the aggregate activity of insiders for all stocks gives significant clues for the whole stock market. Two things must be taken into account when examining insider activity. First, the insiders are usually sellers. Larry Williams reports in "The Right Stock At The Right Time" ([5]) that since many corporate executives are compensated with shares as well as salaries, the normal sells/buys ratio for the insiders is about 2.5 while others consider that this ratio is much greater than that. Second, insiders normally buy into price weakness and sell into price strength therefore, as George Muzea pinpoints in "The Vital Few vs The Trivial Many" ([1]), it is important to look for deviations from this behavior. Generally, insider buying during an uptrend is much more bullish than insider buying during a downtrend and selling during a downtrend is much more bearish than selling during an uptrend. Additional sophisticated concepts relative to the interpretation of insiders can be found in Muzea's book and result reports concerning the usefulness of SEC filings can be found in "Investor Intelligence from Insider Trading" by Nejat Seyhun ([3]). My research on a number of stocks shows that in terms of both quantity and quality of the difference between the aggregate insiders' buy transactions and aggregate insiders' sell transactions for the last months of 2007 were in multiyear highs and as mentioned above this is a very strong bullish sign.
The Third Indicator: Performance of Sectors
It is well known that each stock market sector has its forte at a specific time during the business and stock market cycles. This is commonly known as "The Sector Rotation Model" (SRM). Peter Navaro's book "When the Market Moves, Will You Be Ready?" ([2]) covers this subject very well and it is my recommendation for those who wish to find compact and decent information on the model. From a hardcore view of fundamental analysis, one should try to identify the current position of the economy in the business cycle, then project this position in the stock market cycle and finally identify the sectors that will likely outperform the market in the near future. A different more technically oriented view is to reverse the previous method and use the sectors performance to identify the current position in the stock market cycle. Since the SP500 index is regarded as the most reliable proxy for the US stock market one can use the SP500 sector exchange traded funds (ETFs) to accomplish the latter.
Figure 3 illustrates the sector ETFs that are likely to perform well during the various phases of the stock market cycle according to the SRM. Study figure 3 carefully and then take a look at figure 4 where the percentage change between the end of September 2007 and the end of December 2007 is shown. Now go back to figure 3 and identify the position in the stock market cycle (black curve) which should correspond to the data from figure 4. It should be readily apparent that the SRM sends bearish signs about the stock market.
The Fourth Indicator: Cash Levels of Mutal Funds
Mutual funds (MFs) are among the big players in the stock market game and their positions and intentions admittedly affect the performance of the stock market. Each month the Investment Company Institute releases information reports regarding the US mutual funds industry. Amongst the various important issues one can find in these reports is the liquid assets of MFs (also called cash levels). According to Larry Williams ([5]) when MFs are sitting on a great deal of cash on a relative basis it means they can buy and push the stock market prices higher when they have very little cash on hand it's very difficult for stock prices to go higher. This is not a new idea. It is based on a fundamental tenet of trading: "when all are on the bullish side no one is left to buy".
By this token, take a look at figure 5 where the aggregate raw cash levels of the MFs are shown from 2001 to the mid 2007. The figure is clearly disappointing as it shows that the MFs are heavily loaded and have the least cash on hand relative to the past.
The Raw Results
A simplistic study of commercials, insiders, sector rotation and mutual funds cash levels do not seem to produce a meaningful answer about the prospects of the stock market for 2008. The activity of commercials and insiders implies a strong market while the performance of sectors along with the mutual funds cash levels sends serious bearish signs.
A More Sophisticated Approach
While the raw study of the four indicators gives no straight answer I have the impression that a more detailed look puts more ticks in the bullish side and this is for a couple of reasons. First, the commercials and insiders are by definition those who know better and their activity must be taken more seriously into account. Their bullish attitude during the last months of 2007 is remarkably unusual and reasonable implications from this attitude have not surfaced yet. The performance of sectors on the other hand is a combination of all market participants making the third indicator a little less significant. Second, a long term falling cash level of mutual funds alone does not seem to have the strength to reverse a bullish market (take a look at the trend of the cash levels of MFs from 2003 and thereafter in figure 5). Also, the fact that the mutual funds are heavily loaded with respect to their assets does not mean that they will not have fresh cash to invest if new individuals give them their money which leads to the third reason: the massive entrance of the general public. Beginning from 2003 we have faced a remarkable bull market but in my opinion we have not yet seen a wider distribution of stocks to the general public.
In Conclusion
I tried to cover and analyze the performance of four of the most significant stock market indicators during the last months of 2007. Two of them gave bullish signals and two of them gave bearish signals for the beginning of 2008 but in terms of quality I believe the weight is more on the bullish side. In any case, all the indications require confirmation from the market and this is where technical analysis comes in. During the last months of 2007 the stock market is fluctuating trying to find a direction and the strong multiyear uptrend that started in 2003 is in serious danger. The technical signals in the broad stock market indices will give the final answers. One thing is for sure however: This unusual coexistence between extreme readings in the four indicators and its implications should be noted for future reference when similar situations emerge.
Staying Up to Date
There are subscription sites where most of the data I have presented here is available in a convenient form. You can however monitor the indicators for free on the Internet as all of the data is publicly available from official and unofficial sites.
REFERENCES
[1] Muzea, George, The Right Stock at the Right Time: Prospering in the Coming Good Years, Wiley (2004).
[2] Navarro, Peter, When the Market Moves, Will You Be Ready?, McGraw-Hill (2003).
[3] Seyhun, Nejat, Investment Intelligence from Insider Trading, The MIT Press (2000).
[4] Williams, Larry, Trade Stocks & Commodities with the Insiders: Secrets of the COT Report, Wiley (2005).
[5] Williams, Larry, The Right Stock at the Right Time: Prospering in the Coming Good Years, Wiley (2003).
Last edited by a moderator: