Weak buyers and weak sellers, how do we identify them and why.

Shak you should be a detective! When larger players enter/exit they have to be careful not to move the market against them. anything about 500 lots ish on the ES will take out a price level during RTH. So entering for them is about accumulating a position over a range of prices and exiting where there is enough liquidity to get out.

When you say, move the market against them, do you mean pushing price in the direction that they're trading before they've established their full position?

Also, from your post, do you then think that entering and exiting are accomplished in the same way? I won't argue with that, however, I would suggest that if you have the power to move the markets, then you have an interest in something happening after you've established a new position, whereas after exiting, your interest is not the same. Shouldn't this be detectable?
 
Lets see if there is any life left in this thread.

Can we identify the difference between strong hands taking profit and strong hands entering a new position? If so, how?


Before you can answer this;

Is it not crucial to identify the differences between weak and strong hands?

Is it to do with funds, technology, information, or could it be something totally different, and nothing to actually do with trading at all?

Is a strong hand a pro trader? Do they work for institutions? Are they private? Do weak hands work at banks and institutions? If so are they just protected by infrastructure, hence when they trade there own private account (exposed), they tend to be very average at best?

So what is strong and what is weak;)

Credit to you for trying to get something from this topic, not easy, but essential to get to the next level. only IMO of course.
 
When you say, move the market against them, do you mean pushing price in the direction that they're trading before they've established their full position?

Yes.

Also, from your post, do you then think that entering and exiting are accomplished in the same way?

No the process of accumulation is different to the planned exit. Very different.

I would suggest that if you have the power to move the markets, then you have an interest in something happening after you've established a new position, whereas after exiting, your interest is not the same. Shouldn't this be detectable?

Correct. If you are long you need people to buy at higher prices than you. When larger players accumulate they are looking to do it in a way that they don't push price too quickly their way. Yesterday there was a fat finger trade in HSBC, obv a large trader you can check the 5s chart on twitter. Thats what happens when you drop size on the market and if you are accumulating you don't want that to happen because you cant get out for a profit.

Maybe we can talk through some examples. What is your fave instrument? (not forex).
 
Last edited by a moderator:
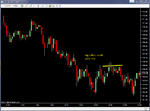
possible stop collection occurring right now on ES 64.00s

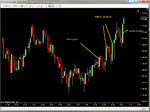
price took the 64.00s where stops were then they tried to push it back through 65.00s, couldn't do it so that was a sign of weakness. Big sellers at 61.50 couldn't push it lower, that's where I entered most of my position. 65.50s are now key as you can see shown on the tape, these guys will puke if price goes a few ticks against them.

Anyways I am done for the day took +900, it wasnt a clean example but hopefully you can see how this could play out if these guys puke from here.

GTTY
 

Attachments

  • screencap 1.png
    screencap 1.png
    72.9 KB · Views: 291
  • screencap 2.png
    screencap 2.png
    41.4 KB · Views: 280
  • screen cap3.png
    screen cap3.png
    14.7 KB · Views: 283
  • screen cap4.png
    screen cap4.png
    58.1 KB · Views: 295
Last edited by a moderator:
back to my screens after a glorious 6" subway lunch. I see those 65.50s did puke it out.:cheesy:
 

Attachments

  • screencap5.png
    screencap5.png
    71.5 KB · Views: 357
Before you can answer this;

Is it not crucial to identify the differences between weak and strong hands?

Is it to do with funds, technology, information, or could it be something totally different, and nothing to actually do with trading at all?

Is a strong hand a pro trader? Do they work for institutions? Are they private? Do weak hands work at banks and institutions? If so are they just protected by infrastructure, hence when they trade there own private account (exposed), they tend to be very average at best?

So what is strong and what is weak;)

Credit to you for trying to get something from this topic, not easy, but essential to get to the next level. only IMO of course.

I have a concept of what strong hands are, although it is probably wrong!

In my mind, it's not to do with technology. There are strong and weak hands in institutions and strong and weak hands that are private traders.

Weak hands are emotional, easily pushed around, predictable in their responses, followers, guessing.

Strong hands are in control of themselves, have a plan that they believe in, have knowledge (not insider, just knowledge of what they are doing), are not easily predictable (except perhaps in how they utilise weak hands predictability).

I apologise for this being vague, it is something that's hard for me to define.

How do you define strong hands and weak hands (or what differences do you identify?).
 
Last edited:
Nice.
I'm down nearly $800 so far :cry:
NQ and CL tag teaming me :devilish:

ha. chin up son. I dislike thin markets as it's harder to read the flow. Cant trade CL for toffee but it always looks so tempting. The ES is a little thin for my liking but there is so much joooooce.
 
Last edited by a moderator:
Does your methodology not work on certain instruments?
Wouldn't the weak vs strong hands stuff work on every market?

Thin markets whip up and down making reading the tape very difficult. I find the ES too fast at times it can fry your brain. Thats why FI is my bread and butter.
 
What I think is better for me is when the market gets into the tighter 6-8 tick ranges where you know stops are either side. If this range happens after a move up, you know there's a slightly higher chance of an upside break, so you get in @ the low of the range, scale some close to the top and then sit on it in an effort to capitalize on the break. You could well get stopped out on it and you could get shaken out with a poke through the range that then fails before it goes upside but I think on balance, it's a better way to play it (for me).

No idea if this post will resurrect the thread, but in my opinion it represents one of the few good ones as it deals with market structure and the auction process, all of which are too often ignored for things like moving averages and other guff.

Am posting to help others try to work out the clues, and to also order my own ideas and out them down onto paper.

The quote I've included above from DT is an actual workable trade idea which I do use, and most importantly, you will see this pattern on practically every single trading day.

And why does this work consistently? AS DT says:

"The point is - there IS a fair amount of short term speculation going on. The percentage differs depending on what's driving the day. It does NOT have to be retail speculation for people to be wrong.
So - I wouldn't underestimate trapped traders as a force to drive a short term move because they are clearly visible as they exit."

So how does this info work on a tradeable basis?
For me, it goes into the age old argument about support and resistance and what it actually represents. For example, what is the head and shoulders pattern and what does it tell you in terms of analysing who is buying and selling on this formation and why. This sums up the problem with many posts on trading-we talk about the pattern and yet don't analyse what the pattern represents in the same way that no-one studies the meaning of the idea that a price tends to break on the third test of a level. Why is that??

I'm on a laptop so cannot post charts at the moment-if anyone is interested I'll continue talking about this and see what other people have to say on the subject as whilst I think I'm correct, there may be further insights by others.
 
I'm on a laptop so cannot post charts at the moment-if anyone is interested I'll continue talking about this and see what other people have to say on the subject as whilst I think I'm correct, there may be further insights by others.

I've been posting about just this sort of thing in the Wyckoff thread:

H&S 1

H&S 2

As for trading the breaks of failures, this and the following sequence may provide an example of what you're referring to. One can skip the babble and just review the charts and most likely get the gist.

As for why the "H&S" forms in the first place:

Take, for example, the famous "head and shoulders", a pattern which pattern traders hold close to their hearts, even though they so often call it wrong and trade it badly.

We all know the drill: the head is higher than the left shoulder and the right shoulder should be lower than the head and what is called a "neckline" should be drawn under all of this and the trader should sell short a break below this neckline and the expected target is blah blah. But if instead one knows why these form in the first place, he will be less likely to find head-and-shoulders underneath every bed and trade only those which are manifestations of deliberate behavior rather than those which are essentially bunnies in clouds.

What exactly is the behavior that creates a genuine "head and shoulders"?

The H&S is a manifestation of a certain buying/selling dynamic. In this dynamic, buying in a bull move is composed of three waves - smart money, dumb money and dumber money. Underneath each of these waves is drawn a 'neck-line', which represents the approximate points at which prices fade off the peak of each wave.

Wave 1 consists of smart money and forms the left shoulder. It represents the activity of professional (big money) buyers operating 'in secret', quietly accumulating shares. These buyers have a 'real reason' to pick up shares, one derived from research (not just "it seems like a good idea"). These buyers are not momentum traders (as at this point there has not been enough momentum to attract the attention of momentum traders). As such the volume will be higher than normal but not so high that it scares buyers away. In fact, it can't be too high since buyers are only beginning to be attracted to the potential, and without lots of buyers, volume will be relatively low.

Wave 2 consists of dumb money and forms the head. These buyers missed the first big move up, the strength of which attracted their attention in the first place. They take advantage of the fade in prices off the peak of the left shoulder and use it to aggressively accumulate shares. This volume is typically the highest.

It is before the top of wave 2 that the professionals responsible for the first leg up start to unload shares, which is what causes the top in the first place. Since they have been vested in the stock from the beginning, they recognize when things are getting 'frothy' and are alerted by the frantic buying of the momentum crowd (who are more concerned with missing 'the next big thing'). It's sort of like the end of a party where all the suits have gone home and you are left with a bunch of milling drunks. Prices fade back to the last swing low and form what may become the neckline.

Wave 3 consists of dumber money and forms the right shoulder. This last group of buyers missed both waves 1 and 2 and looked at the fade in prices as yet another buying opportunity. These traders/investors consist of both new money and those who entered positions late in the second wave and are thus sitting on paper losses. The volume in wave 3 is typically weaker than that forming the head and the left shoulder. So the rise in prices here is short-lived due to the fact that it is even less grounded that the rise that formed the head. These buyers are also the most easily panicked.

Once prices fade off the right shoulder, the formation is confirmed when prices break below the neckline. Typically, though not always, prices come up from beneath the neckline and touch it. Like a hot stove. This is where the short hammer is dropped. (Db)


Those who are trading the pattern, in other words, are often trapped by it because they don't know why the pattern forms, they wait far too long, and the professionals were bought when price told them to are waiting to take advantage of those who are entering so late.

Db
 
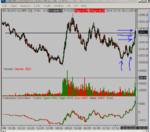
In an effort to keep this thread going, here's what strong buyers and weak buyers look like.
The cra*py vertical arrows are where the strong buyers are. They are strong because they can weather a dip in price from the current higher levels without sustaining a loss and being shaken out of their position.

Those who bought much higher, where the weak horizontal arrows are, are the weaker buyers. They are much more liable to losses from their poor/late trading position, and are more likely to exit quickly if price moves against them, hence they are 'weak.'

So now we know what they are, how do we identify them. Good question. No idea. That's where support and resistance comes in.
One thing that I do is that I always look for areas where price has reversed many times in the course of the trading day. If reaching a reversal point then go short.

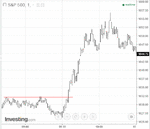
Using the attached chart, if you went short at 48-49 you would be one of the strong sellers (if you are correct of course and price moves down!). Not that I'm saying this is a fabulous area to enter due to price moves that may support this higher price/may act as a brake against a drop in your favour.
But looking left at the chart, you can see a head and shoulders pattern where price reversed twice at the 48 level. If you went short here, would you be dumb? In my opinion: not really!
 

Attachments

  • strong vs weak.PNG
    strong vs weak.PNG
    36.5 KB · Views: 340
Actually the strong buyers are those who propelled price higher in the first place, just after the open. They then began selling at 1840, then again at 51 and 52. They were pretty much out by the time they ran out of buyers at 57, at which point they were ready to short at 51 and further at 58.

Db
 

Attachments

  • ES.gif
    ES.gif
    20.5 KB · Views: 272
Actually the strong buyers are those who propelled price higher in the first place, just after the open. They then began selling at 1840, then again at 51 and 52. They were pretty much out by the time they ran out of buyers at 57, at which point they were ready to short at 51 and further at 58.

Db

Different timeframes mate.
 
Different timeframes mate.

If one looks only at the period after lunch. But it wasn't small retail traders who propelled price that far that fast at the open. By the time price rolled over, it was pretty much done until after lunch. Not that there weren't strong buyers/sellers after the initial move, but the strong buying and selling began much earlier.

Db
 
"If one only looks at the period after lunch"
Yup, as I said: different timeframes mate.
Was just providing a chart based indication of weak v strong buyers using chart swings. No need to complicate matters further.
 
Top