Best Thread Vwap Engine

17 March more trades

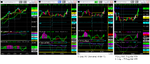
What a nice day!! VWAP ENGINE rocks ............................

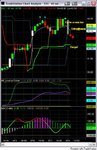
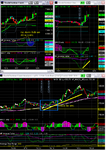
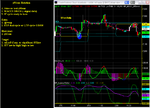
ES followed NQ with a white cycle cross bar. Long set up with
Time: 18:43/44
entry : 763
stop : 757
target : 768/ open based on 60cycle ( possible areas 774/782)
( target1 reached, best to close at end of day 775)

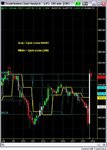
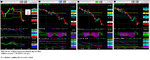
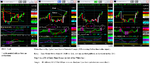
There is another long signal for NQ at 1173 that also went very well. It was just 'observed' to limit the exposure.

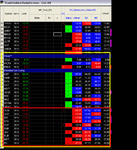
No signals for YM or INDU itself.

Today's results really boost my confidence in the system.
 

Attachments

  • 090317 indices end of day.PNG
    090317 indices end of day.PNG
    66.8 KB · Views: 244
18 March

It is FOMC day so it could be slow before the announcement. YM has given a short signal but I am shorting one of the weak stocks in my list.

EXC short
Entry: at vwap 43.09
Stop : 43.90
Target : 41.80

There was a quick long signal for ES I will post it if I have time.:)
 

Attachments

  • 090318 EXC.jpg
    090318 EXC.jpg
    72.6 KB · Views: 260
Indices have turned back up but EXC is still around vwap at lower prices. Thats the advantage of picking weak stocks to short in stead of index futures. Had I shorted YM in stead of EXC, it would have been stopped out. INDU cash is still in no-sellshort mode ( so no shorting YM), and that is holding the stocks from diving down.
 
White GOLD

this is interesting..
 

Attachments

  • 090318 YG H4.jpg
    090318 YG H4.jpg
    71.1 KB · Views: 240
There was a quick long signal for ES I will post it if I have time

This scalp has developed into a nice long trade. See the chart below.

However as it is FOMC day, it's best to stand aside and be an observer. ( but the points are mouth watering........)
 

Attachments

  • 090318 ES long.PNG
    090318 ES long.PNG
    69.6 KB · Views: 217
Today is still no sellshort day for me. INDU CASH is still in bullsmode although daily looks exhausted.

Ok, here are two reversal to mean/vwap trades-

1. ES : long 782.75 Stop 778, Target VWAP (around 788)
2. NQ : long 1201 Stop 1193.50 Target VWAP around 1207

If ETF (entry level tick time frame) turn against them, they will be out before hitting stops.
 
19 March

Nothing much except picking stocks for position trades. My position trade means swinging with daily TF. here is my list (the ones in the red box are already down for the day)
 

Attachments

  • 090319 Swingshort candidates.PNG
    090319 Swingshort candidates.PNG
    44.3 KB · Views: 250
20 March

Mean rotation

This terminology is not mine I think it's Joey25's, thanks! Anyhow, this is my interpretation and how I'd do it. This is PA setup and cycles are just there to increase confidence and get a nice entry.
 

Attachments

  • Mean Rotation YM090320.PNG
    Mean Rotation YM090320.PNG
    48.9 KB · Views: 260
Ta for the mention mate!

If it's any help, I've found that those means which are swiftly rejected by a Wide Range Bar offer the greatest potential on the first re-test.

If a mean forms and price also settles near that mean, then it probably signifies continued rotation, and the important levels become the +/1 standard deviation (Value Area) and +/- 2 standard deviation (Bracket) levels.

Cheers,
Joey

Excellent! I tend to watch PA around previous means. The idea is to get an entry at the smallest TF possible to minimise the risk, however, I find is that stoploss levels based on SR lines are better than that are based on the ATR/stdDev. cheers!
 
I will take a break from trading for a few days as I will be travelling. As per my analysis, $INDU is still in bullish mode and no shortselling rule works very well. However, that may change within a few days/ starting from tomorrow onwards, we'll see. Price action will tell us.

So.... see you all when I am ready to post again. til then..... happy trading..!!!!
 
I'll have to pick your brains about stop trailing at some point.

Too battered and bruised at the moment though.

Have a good break!
 
I'll have to pick your brains about stop trailing at some point.

Too battered and bruised at the moment though.

Have a good break!

thanks Joey.

As for stop trailing, the right person may be Trader-Dante. My kind of style is to set it at break even as soon as it's moved one complete cycle in entry timeframe. Yeh, trade management is even harder than finding a good entry. I will try my best to answer your queries when I'm back. cheers!
 
macci

Anyone know how to calculate the MACCI? Is there tradestation code floating around for this?
 
Tradestation Version (CCi Average)
Code:
inputs:
	CCILength( 14 ),
	CCIAvgLength( 9 ),
	OverSold( -100 ),
	OverBought( 100 ) ;

variables:
	CCIValue( 0 ),
	CCIAvg( 0 ) ;

CCIValue = CCI( CCILength ) ;
CCIAvg = Average( CCIValue, CCIAvgLength ) ;

Plot1( CCIValue, "CCI" ) ;
Plot2( CCIAvg, "CCIAvg" ) ;
Plot3( OverBought, "OverBot" ) ;
Plot4( OverSold, "OverSld" ) ;

{ Alert criteria }
if CCIAvg crosses over OverSold then
	Alert( "Indicator exiting oversold zone" )
else if CCIAvg crosses under OverBought then
	Alert( "Indicator exiting overbought zone" ) ;

Man who may not be mentioned version (MACCi) :

Code:
inputs:
	CCiLength( 6),
	MaLen(5),
	OverBought(100),
	Oversold(-100),
	AlertLevel(80);


variables: CCIValue( 0 ) ,MACCI(0),permission(0); 

CCIValue = CCI( CCiLength ) ; 
MACCI = Average(CCIValue,MaLen); 
 
Plot1(MACCI, "MACCi"); 
Plot2(OverBought,"OverBought"); 
Plot3(Oversold,"Oversold"); 
plot4(0,"Zero");
Plot5(+Alertlevel,"Alert");
Plot6(-Alertlevel,"Alert");


If MACCI crosses above 0 then permission = 1;
If MACCI crosses above AlertLevel and permission = 1 then begin
	Alert("MACCI Crossed above AlertLevel");
	permission = 0;
end;


If MACCI crosses below 0 then permission = -1;
If MACCI crosses below -AlertLevel and permission = -1 then begin
	Alert("MACCI Crossed below AlertLevel");
	permission = 0;
end;

MACCi = CCi Average, CCi Average = MACCi

OK - the MACCi has 2 lines of redundant code - but apart from that they are the same :LOL:
 
We can short indices now

30th March

No short-selling condition from INDU Cash has been breached. Equity indices have been rejected from Monthly Mean area. My expectation is that they will re-test Daily Means and then probably resume upward as it looks like a nice set up for April rally. Let's see..
 

Attachments

  • 090330 equity indices.PNG
    090330 equity indices.PNG
    63.4 KB · Views: 237
Thanks for the formula Pedro...just coded it into esignal...seems to work, but I will fool around with it some more.

Try 6/5 together with 20/6 settings. It takes a while to get used to two cycles but you'll see the benefits.
 
1st April Equity Indices

Nice cycle cross up across the board. I could wait until ES touching m2 at 812 but YM and NQ both have already touched m2. Time to close long position on H1 (60min) cycles OB.
 

Attachments

  • CycX 090401 Equity Indices.PNG
    CycX 090401 Equity Indices.PNG
    71.3 KB · Views: 256
With the benefit of hindsight, I can say I should have re-entered a long position before the close. Profit taking did happen as expected by cycle OB however there were clear entry points in Entry TFs in all of them just before the close. 10pts ES in the bag and aversion to overnight holding have made me missed 200pts in YM and 20+ pts in ES. well, I can wait for another set up...
 
Top