Value areas for stocks

Here's the numbers for AAPL and FAS on Tuesday

AAPL

HVA:138.28
LVA: 136.40


FAS

HVA:8.88
LVA: 8.24
 
Hello Joe! Can you explain the interpretation of the points of control and high/low value areas.
Thank you!
 
Hey there,

Well, as far as getting the numbers, you'll need market profile charting software, I haven't found any for free yet.

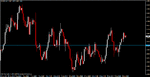
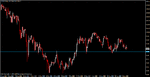
There's a lot you can do with market profile, and I think the video gives some examples. Basically, you can use them as support/ resistance areas. For example, buying the High value area of FAS on Friday was a great buy. I was holding out for the point of control but didnt get filled. On a choppy day, the high value area is a place to short, and the low value area to buy.
 

Attachments

  • Market_Profile_Basics.pdf
    471.5 KB · Views: 863
Last edited:
or a quick and dirty way to get the same, if not a similar result is to find the volume weighted average price.

you can eye ball this on a chart, it is a price area where the majority of the volume came into the market , otherwise known as, the point of control or the median price for a given period of time
 

Attachments

  • eurusd.gif
    eurusd.gif
    22.4 KB · Views: 216
  • usdjpy.gif
    usdjpy.gif
    20.1 KB · Views: 216
Last edited:
The full understanding and use of market profile is actually a pretty big subject. But you can dumb it down a lot and make money just using the value areas as support/resistance. Think of them as pivots that are derived from the previous days trading environment. The value area high is the top of the trading range and the value area low is the bottom.
 
Top