The S&P-500, Nasdaq-100 and Russell-2000 serve this purpose for a broad basket of equities, grinding through easily observed cycles that tell participants how aggressive or defensive they need to be as they enter the market day. Popular analysis tools like stochastics and Wilders RSI measure these impulses, often with startling accuracy. In turn, investors and traders can use these measurements to time entry, exit and risk-management strategies, whether they're focused on the intraday, daily, weekly or even monthly holding periods.
Stochastics
Securities trader George Lane popularized the stochastics indicator in the 1950s. It's a deceptively simple formula that compares the current price bar to a preset selection of highs and lows. Perhaps due to its simplicity, many 21st century technicians fail to comprehend its immense power in predicting cyclical turns on indexes and individual instruments. That makes it a nearly ideal tool for deconstructing hidden forces that move modern markets. As always, tackling analysis from several directions produces more reliable outcomes, and stochastics works best when combined with price patterns, moving averages and momentum tools like the moving average convergence divergence (MACD).
Stochastics define overbought and oversold levels when cycles hit their peaks and are ready to roll over. However, we know from experience that markets can stay overbought or oversold for long periods of time. This caveat confuses market players who are looking for Holy Grail-type indicators that elicit simple and unambiguous signals in all cases. This natural uncertainty requires specific price and time filters to improve predictability. The two lines created by the indicator serve this purpose, delaying validation of cyclical turns until they cross over at extreme levels and then surge toward the midpoint of the analysis grid.
Weekly cycles in particular show tremendous value in market timing for both major instruments and individual positions. Stochastics is nearly bulletproof when it comes to this macro market analysis, especially when broad averages push into key support or resistance levels and technicians are scrambling to call for a breakout or a failure that triggers a major reversal.
Investors and traders have a lot at stake at these inflection points in deciding whether to buy in anticipation of a breakout or breakdown, or to fade in the current direction and enter a contrary position that yields profits during a reversal.
Let's look at two weekly stochastics applications you can use to improve your market timing.
Crosses and Confirmation
Source: eSignal.com
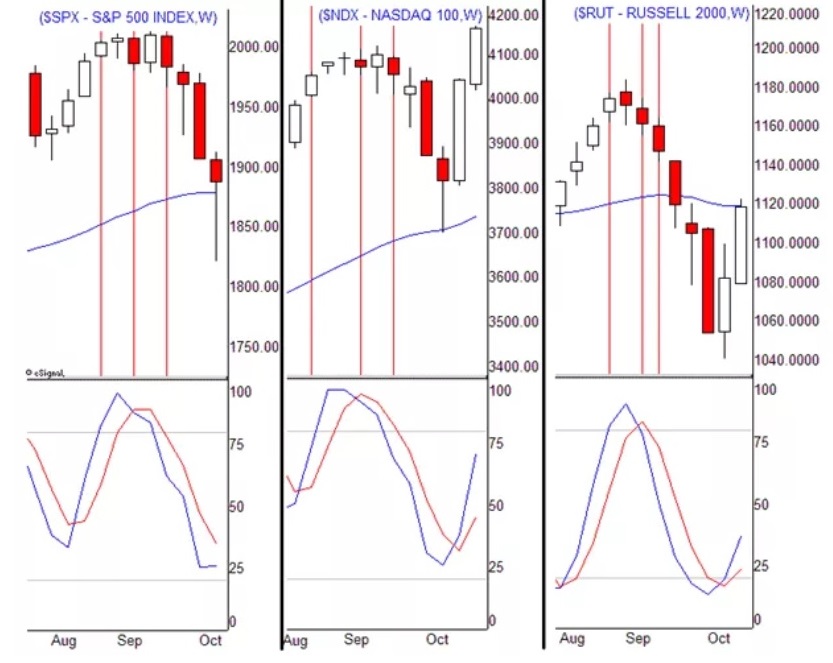
It's an August weekend, and you're reviewing the market's progress to see if any adjustments are required to your ample long-side exposure. The S&P-500 and Nasdaq-100 have just hit bull market highs, but the Russell-2000 is underperforming, caught in a big trading range. Stochastics on all three instruments have risen into overbought levels.
There's no need to be concerned when stochastics first rises above the magic overbought line. In fact, markets often book their strongest gains when indicators are grinding at those extreme levels. However, it is now telling you to sit up and pay close attention because a bearish crossover into a new sell cycle lasting 6 to 12 weeks could come at any time.
The next change in technical conditions comes when the stochastics fast lines (blue) cross over the slow lines (red) in the first two weeks of September. This triggers early warning signals for new sell cycles that will remain unconfirmed until the fast lines surge below overbought levels and toward midpoints of the analysis grid. That occurs rapidly after the crossovers, confirming the start of new sell cycles.
If you're trading indexes directly through futures or exchange-traded funds (ETFs), these bearish signals should be used to sell long positions or open new short sales. It's a different story if you're holding equity positions because the impact of index cyclical turns depends on correlation, which denotes the tendency of an individual stock to match price direction with the most related index or indexes. Your positions show correlation if there's observable alignment between the trends and patterns you're trading and price action in the major indexes.
For example, most small-cap stocks correlate strongly with Russell-2000 cyclical turns, telling us that risk increases greatly when holding in the opposite direction of the crossover. It's the same story with big tech and the Nasdaq-100, as well as financials and the S&P-500. Bottom line: Cycle turns are usually wakeup calls to control risk, whether through exits, stops, options protection or position rebalancing.
Weekly Cycles and Cross-Verification
Source: eSignal.com
No indicator works well in a vacuum, and weekly stochastics is no exception. Reliability with this tool increases geometrically when combined with price patterns, Fibonacci analysis and moving averages. In addition to confirming or refuting cyclical turns, the supplementary tools pinpoint specific levels in which intermediate tops and bottoms are printed, as well as predict how far new buy or sell impulses will carry, before counter-impulses set into motion.
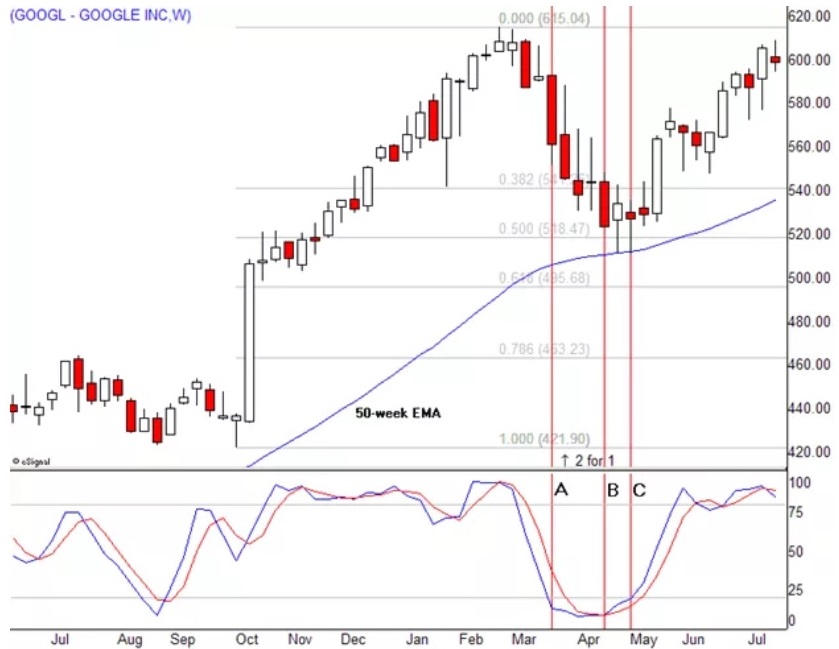
Google stock hit an all-time high above $600 in early 2014 and sold off, with weekly stochastics plunging from the overbought level. It hit oversold readings a few weeks later (A) while price was trading well above the 50-week exponential moving average (EMA) near $500. The indicator crossed over to the buy side in April (B) and went dead as a doornail while the decline continued into early May.
The stock then bounced for two weeks in a row at the 50-week EMA, which had aligned with the 50% Fibonacci rally retracement. The stochastics fast line (blue) lifted above the oversold level during the second week of testing at the moving average, issuing a confirmed buy signal that matched perfectly with a strong bounce that added close to 50 points in the next four weeks.
Risks in Using Weekly Stochastics
Finally, let's consider a few risks in using weekly stochastics for market timing. The indicator can grind out oscillations that challenge accurate prediction because it can spend months without hitting overbought or oversold signals. And, even when cyclical oscillations are beautifully proportioned in size and time, the fast line can still stop midstream and reverse, short-circuiting reversal strategies and trapping cycle traders.
The best defence, given this natural complexity, is to fall back on price pattern and other technical tools when stochastics doesn't emanate a strongly directional signal. In turn, the indicator provides a valuable message about that market's current state, i.e. it's grinding through a confused period in which neither bulls nor bears hold a sizable advantage.
In Summary
The weekly stochastics indicator uncovers repeating patterns of buying and selling pressure that can be predicted and capitalized upon by observant investors and traders. The trick is to go with the flow and align your positioning with these natural oscillations whenever possible.
Smart investors will time their market moves according to the signals being sent by the patterns of buy/sell cycles and will use these to anticipate reversals or opportunities for adjusting their exposure, but they will also temper their approach with the awareness that using other chart tools to complement stochastics analysis is a more fool-proof way to ensure accuracy when tracing the movements of the markets.
Alan Farley can be contacted on this link: Hard Right Edge