Best Thread US day traders thread.

Thanks for the responces guys.... appreciate it!!! :eek:

Hi Dave,

Thanks for the feedback!!
We all see different things, thats the beauty of trading!!!
There no right or wrong in either explanations....... its in the eye of the beholder :)

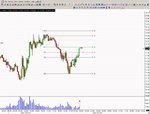
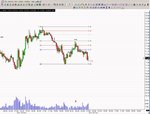
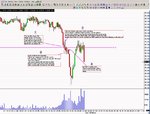
I see the classic quarter century support level & how they worked the orders around it....


I've had a quick look on the 3min chart and here's what I see ;) :)
 

Attachments

  • bars.jpg
    bars.jpg
    109.7 KB · Views: 286
Last edited:
dvdh said:
Hi Bez, Great posts!!

But I'd say support actually came in around the pivot at 79.18. On a 3 min chart. It consolidates a couple of minutes around the pivot and then around 15.10 (5 min) 15.12 (3 min) the bar closes under the pivot. Which gives another short signal. And then it touched the low of Thursday. Which is another support!

That's what I see. I think both explanations would be correct! What do you think, Bez?

-Dave.

Hi guys its Monday again :)

So for traders who are waiting for bar closures before pulling the trigger does this mean that those who were watching 5 minute charts had a 2 minute head start on those who were watching the action on 3 minute screens?

In general do you guys wait for bar closure before entering a trade?
 
samtron said:
Hi guys its Monday again :)

So for traders who are waiting for bar closures before pulling the trigger does this mean that those who were watching 5 minute charts had a 2 minute head start on those who were watching the action on 3 minute screens?

In general do you guys wait for bar closure before entering a trade?

Good question. I'm still trying to figure out the best way:
I started off waiting for a confirmation candle (I use 5 min.) charts but now am just waiting for a decent cents move comparative to the price, to avoid fake-outs.

Getting into Level 2 quite well now - must be if I didn't want to trade without it on Friday(!) and that with the Time and Sales really shows where the momentum is taking the price.

Good luck today, I'm keeping an half an eye on PFE after the patent ruling and am interested to see what happens with IRBT, too.
 
samtron said:
Hi guys its Monday again :)

So for traders who are waiting for bar closures before pulling the trigger does this mean that those who were watching 5 minute charts had a 2 minute head start on those who were watching the action on 3 minute screens?

In general do you guys wait for bar closure before entering a trade?

It is important to watch the formation of the candle. This will show you stalling at S&R
and ease of movement. Always keep your eye on volume.
T&S is better than level 2
 
commanderco said:
It is important to watch the formation of the candle. This will show you stalling at S&R
and ease of movement. Always keep your eye on volume.
T&S is better than level 2

hey a silly question, I simply don't know? :eek:
Is Time & Sales just the same as the raw data feed that is used to construct the charts?
I use QT with IB feed and with that combination I can view Raw Data time and sales.

anyway for know its eyes down look in!
 
Bez said:
I've had a quick look on the 3min chart and here's what I see ;) :)
I can't see anything!
I'm reading this at work (a quiet day) and I'm unable to read the annotations on Bez's chart. Maybe this is just my work P.C. - anyone else got a problem viewing the chart?
Tim.
 
Tim,

I can read the annotations fine. Your browser may be automatically resizing (shrinking) the image to fit in the window? If so if you hover your mouse cursor over it a symbol may appear allowing you to make it full size. Or you can turn off automatic image resizing in the options menu.
 
Strange day?

I have alerts on my core stock list to show me when breaking high or low of day.
Normally, at leeast a couple of these are showing at any given time.

Today, virtually no break signals at all. Is it just an anomaly or is this something that tends to happen pre-Christmas?
 
Spooky

Gadgetman said:
I have alerts on my core stock list to show me when breaking high or low of day.
Normally, at leeast a couple of these are showing at any given time.

Today, virtually no break signals at all. Is it just an anomaly or is this something that tends to happen pre-Christmas?
:eek:
As soon as I posted that, about half a dozen lit up! All lows.
Are we being watched???
 
samtron said:
hey a silly question, I simply don't know? :eek:
Is Time & Sales just the same as the raw data feed that is used to construct the charts?
I use QT with IB feed and with that combination I can view Raw Data time and sales.

anyway for know its eyes down look in!

It is a good question not a silly one.
Why do´nt you go back to your data supplier and ask them for the exact construction.
 
Trading get thinner as xmas approaches, can still be volatile though.

I traded SNDK today - added to watchlist on the basis of activity. Made new highs through the morning session. May well move again in the afternoon session but that will do me today.

Mark


Gadgetman said:
I have alerts on my core stock list to show me when breaking high or low of day.
Normally, at leeast a couple of these are showing at any given time.

Today, virtually no break signals at all. Is it just an anomaly or is this something that tends to happen pre-Christmas?
 

Attachments

  • sndk.JPG
    sndk.JPG
    62.7 KB · Views: 203
samtron said:
hey a silly question, I simply don't know? :eek:
Is Time & Sales just the same as the raw data feed that is used to construct the charts?
I use QT with IB feed and with that combination I can view Raw Data time and sales.

anyway for know its eyes down look in!
Spot on, the prints in T&S is what makes the charts!

I always watch the 3 minute chart. And usually wait for the bars to close if i trade pivot points or moving averages. Definitely not when I trade High/low breakouts. Then you'd be missing out. But if you trade patterns. You always gotta wait for the bar to close. Or you'll be whipsawed!

-Dave.
 
Gadgetman said:
I have alerts on my core stock list to show me when breaking high or low of day.
Normally, at leeast a couple of these are showing at any given time.

Today, virtually no break signals at all. Is it just an anomaly or is this something that tends to happen pre-Christmas?

Wow, that's strange. Don't you have AAPL, GOOG, SNDK, RIMM and AMGN on your corelist.
ESPECIALLY GOOG!!! WOW what a day!

-Dave.
 
Eveing guys late to the party today....the joys for christmas shopping :(

Bit slow on the snap shot...but a familiar pattern on SNDK as it busted the $60
 

Attachments

  • SNDKjpg.jpg
    SNDKjpg.jpg
    69.4 KB · Views: 209
dvdh said:
Wow, that's strange. Don't you have AAPL, GOOG, SNDK, RIMM and AMGN on your corelist.
ESPECIALLY GOOG!!! WOW what a day!

-Dave.

Hi dvdh

Well, I don't have GOOG on my list, I'm still too nervous to trade it!
I do have the others though, clearly something wrong with my alert system :eek:
Back to the drawing board...... it's been working so well up until now, looks like I've got too reliant on it:cry:
 
Gadgetman said:
Hi dvdh

Well, I don't have GOOG on my list, I'm still too nervous to trade it!
I do have the others though, clearly something wrong with my alert system :eek:
Back to the drawing board...... it's been working so well up until now, looks like I've got too reliant on it:cry:

I use alerts in esignal. If you got a big list, then it's a lot of work to put all the alerts in. I actually hate the alerts, but I can't do without'em. Although I didn't hear that many go off today. I just had my second best day ever. All out of my baby, GOOG!!. It should have been way better than my best day. But I didn't trade it when it went up to the new alltime highs this morning. Too bad.
But ey, you can't get everything right?

Hope you had a good day!!

-Dave.
 
Well done guys..!!

The only scanner I use is the Mark one eye ball :eek:

Are you guys using them for 3 bar breaks, 30 min Break outs , Morning Lows/Highs ect..ect???

I "scan" for set ups like AAPL... A classic "B" wave 61.8% pull back after a move down, where you can have a controlled risk entry point....
 

Attachments

  • APPL.jpg
    APPL.jpg
    73.6 KB · Views: 219
  • AAPL7.jpg
    AAPL7.jpg
    73.9 KB · Views: 230
Bez said:
Well done guys..!!

The only scanner I use is the Mark one eye ball :eek:

Are you guys using them for 3 bar breaks, 30 min Break outs , Morning Lows/Highs ect..ect???

I "scan" for set ups like AAPL... A classic "B" wave 61.8% pull back after a move down, where you can have a controlled risk entry point....

I'm using a (very basic) routine I wrote for TradeStation's RadarScreen. Looks for breakouts high/low between set times and for set intervals.

So I start the day on 5 min intervals but not updating until 14.45 to give me 3-bar breakouts. From then on I'm looking for high of day and low of day (but can input any time periods) and also x number consecutive up/down candles.
Example screen shot attached.

The technical term for the problem I had today is called "Thrombosis". There was a clot on it - ME!
 

Attachments

  • TS RadarScreen.JPG
    TS RadarScreen.JPG
    331.8 KB · Views: 269
Last edited:
Top