You are using an out of date browser. It may not display this or other websites correctly.
You should upgrade or use an alternative browser.
You should upgrade or use an alternative browser.
Naz
Experienced member
- Messages
- 1,391
- Likes
- 25
Hi Openmind,
No i dont use margin for swing trades.As you say there is overnight risk but then,i do my homework and make sure there are no results coming up that could affect the stock and also review its past overnight volatility.
I believe many traders miss a trick by only specialising in one style.ie EOD or intra day.There is a flow that exists between both of these.I have a great way of putting these together to give the heads up for some decent swing trading moves.I use no moving averages,oscillators or indicators at all, just a way i've worked out that understands how the intra day movement calls the potential next big swing.
Chartists are very good at looking at a move after its happened and saying oh yes look of course it did this and that.As traders we have to profit before things happen and are to obvious, i believe that understanding intra day movements can do that for EOD swing trades.
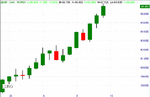
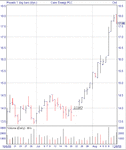
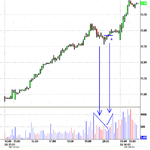
The best move recently i've had using this method was the Nymex crude move that allowed me to play oil stocks like the swing position i took in UK stock Cairn Energy.
Attachment one is the start of the NYMEX crude swing move about JULY 25th
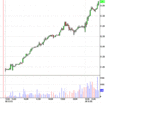
Attachment two is the corresponding Cairn energy move at the same time.
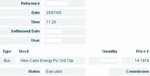
Attachment three is my account details showing my entry at 1419 in Cairn energy on the same day.
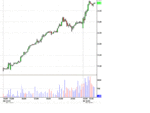
Attachment four under the first chart is the stock still in my account and showing the closing price of 1764 from Fri.
No i dont use margin for swing trades.As you say there is overnight risk but then,i do my homework and make sure there are no results coming up that could affect the stock and also review its past overnight volatility.
I believe many traders miss a trick by only specialising in one style.ie EOD or intra day.There is a flow that exists between both of these.I have a great way of putting these together to give the heads up for some decent swing trading moves.I use no moving averages,oscillators or indicators at all, just a way i've worked out that understands how the intra day movement calls the potential next big swing.
Chartists are very good at looking at a move after its happened and saying oh yes look of course it did this and that.As traders we have to profit before things happen and are to obvious, i believe that understanding intra day movements can do that for EOD swing trades.
The best move recently i've had using this method was the Nymex crude move that allowed me to play oil stocks like the swing position i took in UK stock Cairn Energy.
Attachment one is the start of the NYMEX crude swing move about JULY 25th
Attachment two is the corresponding Cairn energy move at the same time.
Attachment three is my account details showing my entry at 1419 in Cairn energy on the same day.
Attachment four under the first chart is the stock still in my account and showing the closing price of 1764 from Fri.
Attachments
Last edited:
OIl Trade
Naz
I noted your post on the NYMEX crude so that's a great trade on CE. Is Cairn Energy listed on the NASDAQ or have u traded it via LSE?
I'm keen to know how you protect each trade. So far, it's been great to see all your winners and good calls and long may it continue. I do wonder though if you have any losers and how you've managed them. Can u share?
😎
Mr. Charts
Legendary member
- Messages
- 7,370
- Likes
- 1,200
This is what I call a no-brainer trade.
PALM was very strong and was continuing its up trend from y'day. It then pulled back, BUT not very far, and then resumed its up move.
They don't come more obvious than that on a chart.
However, sometimes that is not enough and it's good to have confirmation of what is going to happen next from micro-analysis, so I zeroed down to my level 2 screens where I could see strong buying pressure from the market participants and weak selling pressure combined with further confirmation on the T&S screen.
This was then a no brainer and worthy of a larger position size than normal since the possibility of a sudden contrary move was so low as to be almost off the scale. Had such a move started to develop I would have been out immediately - no question of waiting for a stop to be hit etc
The image shows the point of entry.
Attachments
Hello Mr Charts,
I would be interested to know why you didn't enter the trade at A (in the chart attached). Voume on pullback was declining which is a good sign. If I was trading this (I don't trade US stocks), I would wait for the first up bar to appear and if everything was still well I'd enter a buy stop above that up bar.
Would appreciate your comments.
Many thanks.
Attachments
Mr. Charts
Legendary member
- Messages
- 7,370
- Likes
- 1,200
I then simply followed the trade up as it burst through the whole number triggering all the buy stops everyone had placed just over 34.
Again micro-analysis provided the detail I needed to manage the trade and when I saw all the mad rush of buying was over I exited the trade because I then expected it to come back down to 34.
As you can see price reached a high of 34.24 and this chart is the point of exit from the trade - dictated not by the chart as such by itself, but from a combination of chart plus knowing the way the market works at these levels plus most importantly of all my micro-analysis which told me what was probably about to happen before it did.
This enabled me to extract 34c from the trade in a scenario where the degree of probability of success was so high I could take a larger position size than usual.
Here's the chart of the point of exit.
Immediately after my exit the price fell all the way to 33.50.
In day trading, in my opinion, you must take what the market offers when it offers you money on a plate like this.
BTW, 34.24 remains the HOD so far.
I hope someone finds this interesting and useful.
Richard
Attachments
Mr. Charts
Legendary member
- Messages
- 7,370
- Likes
- 1,200
Hello OpenMind,
Nice to see you posting here on this thread 🙂
1. I wasn't trading last night.
2. I don't trade that near close of trading as time is literally running out, and
3. I don't hold positions overnight
If you want to email me on
[email protected]
we can have a discussion on why I beg to differ with your comment about volume in this particular instance.
I do not choose to discuss this openly as some comments I made about volume a few days ago were deleted by a mod for no reason I can possibly fathom, hence I'll only bother to discuss volume privately.
Kind regards,
Richard
Mr. Charts
Legendary member
- Messages
- 7,370
- Likes
- 1,200
I have just seen the biography icon under the number of posts to the left of these posts.
Credit to t2w for such a sensible innovation.
Credit to t2w for such a sensible innovation.
Mr. Charts
Legendary member
- Messages
- 7,370
- Likes
- 1,200
No, in the price and volume thread.
I did complain off line and a mod kindly replied asking for details, but it had been deleted so what is the point - I have more important things to do than re-write postings with my slow laborious two finger typing.
And actually I have had quite a few of my posts deleted - that's ok, it's their right to do so - no problem.
But it doesn't encourage frequent posting ..........
I'll answer your email shortly.
Richard
Naz
Experienced member
- Messages
- 1,391
- Likes
- 25
Naz
Experienced member
- Messages
- 1,391
- Likes
- 25
Mr. Charts said:I have just seen the biography icon under the number of posts to the left of these posts.
Credit to t2w for such a sensible innovation.
Oh yes very nice,seems i've got one as well.
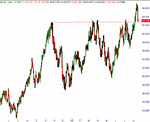
Naz said:I'm always looking at crude at the moment.For those that are interested here is the latest situation.Is this a pullback following the breakout? I always trade what i see and not what i think but make your own mind up.
Hi Naz,
that crude chart of yours, seems like a pullback to confirm the head and shouders or triangle. (I see multiple upside patterns). Do you see that as well? I shorted oil after the inventories numbers when it made new highs. In my opinion, if it retraces 50 % to the upside again, I'd be looking for a long position up to 70 dollars. Might seem a bit optimistic, but the sky is the limit, isn't it? What do ya think about that Naz? By the way, where are you located?
A question that I thought someone on this thread might be able to help me with
I've recently started day day trading US stocks using charts and L2, have been position trading for a few years and by applying similar setups (and a couple of others that I've learned specifically) and risk management I am making a profit but want to improve.
I have been doing a lot of reading but I am confused by what I've read about interpreting the time and sales screen. I have read that large (>25k) prints on the bid suggest near term selling and on the ask, buying interest. Having spent hours looking for these patterns I really can not see that it helps.
Does anyone else do this ?
Does it work for you ?
Anyone aware of any decent literature on the topic ?
Any thoughts appreciated.
Thanks
Mark
Mr. Charts
Legendary member
- Messages
- 7,370
- Likes
- 1,200
"I have read that large (>25k) prints on the bid suggest near term selling and on the ask, buying interest. "
I'm afraid that is just not right.
This is a large subject with several factors which interplay. It normally takes a few hours to teach the basics 1-2-1 so a simple answer on a BB is totally inadequate, useless in fact. After someone understands the concepts, experience is needed before they can start to use these skills effectively to generate substantially more profits.
There is no book or web site which explains what you need to know, I'm afraid. There have been one or two published but they are completely out of date and of no value, in my opinion.
Richard
I guess I was also trying to wrok out how important this is. On one hand I'm (in my view) doing ok for a beginner, but on the other hand I'd like to improve. I singled this out because of all the areas I've researched, it's the one I don't understand to my satisfaction.
I have no objection to investing in tuition, if the quality is good, but I'm surprised if this is a significant part of day-trading and there are no other worthwhile resourses ?
I have no objection to investing in tuition, if the quality is good, but I'm surprised if this is a significant part of day-trading and there are no other worthwhile resourses ?
Laytonm
Why don't you ask some of his students how effective a teacher Mr Charts is ?
I understand that Timsk ( a notable T2W member ) lost his shirt ( or a sizeable part of it ) shortly after visting Mr Charts for a 1-2-1 session involving the use of his "famous" microanalysis techniques.
Why don't you ask some of his students how effective a teacher Mr Charts is ?
I understand that Timsk ( a notable T2W member ) lost his shirt ( or a sizeable part of it ) shortly after visting Mr Charts for a 1-2-1 session involving the use of his "famous" microanalysis techniques.
Similar threads
- Replies
- 775
- Views
- 230K