fatowl
Junior member
- Messages
- 33
- Likes
- 0
Stock aficionados, we all know that not every trend plays out the same way. Some trends proceed quietly and some proceed with high volatility.
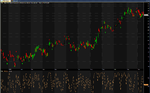
The trends with high volatility can be played by trend-followers but the danger is getting stopped by a whipsaw. These types of trends are more favorable to the mean-reverting trader. I attached an example from 2003: TXN rose about 100% through the year with high volatility. You'll notice trading signals based on a mean-reversion system. Buy when RSI(2) < 5, and sell when RSI(2) > 70. The rules for shorting are similar: Short when RSI(2) > 95, and cover when RSI(2) < 30. This mean-reverting system actually made money during this incredible trend.
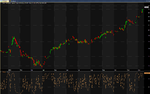
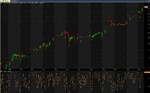
However, take a look at big steel stocks like X and MT during the same year (attached also). These stocks had tremendous gains through 2003 as well. X rose about 100%, and MT rose about 300%. However, their trends were very non-volatile. This is great for a trend-follower as the stop-loss signal will likely not get filled during the year. The mean-reverting system I mentioned in the previous paragraph does poorly as you can see from the trading signals in the pictures.
My question is: Was there any underlying behavior of the market participants that caused high volatility in TXN and low volatility in X and MT? Were there more big players like hedge funds and proprietary traders involved in TXN? Were there more long-term investors in X and MT?
I don't think that comparing the statistical volatility of the stocks will lead to any useful information. If the statistical volatility is low for X and MT, but high for TXN, how can we be confident that future volatility of each stock will be the same? We can't.
So, I'm asking is there any underlying behavior of the market participants that produced the low-volatility trends of X and MT and conversely produced the high-volatility trend of TXN?
The trends with high volatility can be played by trend-followers but the danger is getting stopped by a whipsaw. These types of trends are more favorable to the mean-reverting trader. I attached an example from 2003: TXN rose about 100% through the year with high volatility. You'll notice trading signals based on a mean-reversion system. Buy when RSI(2) < 5, and sell when RSI(2) > 70. The rules for shorting are similar: Short when RSI(2) > 95, and cover when RSI(2) < 30. This mean-reverting system actually made money during this incredible trend.
However, take a look at big steel stocks like X and MT during the same year (attached also). These stocks had tremendous gains through 2003 as well. X rose about 100%, and MT rose about 300%. However, their trends were very non-volatile. This is great for a trend-follower as the stop-loss signal will likely not get filled during the year. The mean-reverting system I mentioned in the previous paragraph does poorly as you can see from the trading signals in the pictures.
My question is: Was there any underlying behavior of the market participants that caused high volatility in TXN and low volatility in X and MT? Were there more big players like hedge funds and proprietary traders involved in TXN? Were there more long-term investors in X and MT?
I don't think that comparing the statistical volatility of the stocks will lead to any useful information. If the statistical volatility is low for X and MT, but high for TXN, how can we be confident that future volatility of each stock will be the same? We can't.
So, I'm asking is there any underlying behavior of the market participants that produced the low-volatility trends of X and MT and conversely produced the high-volatility trend of TXN?