Whilst I generally shudder when I recall my first naïve steps in the world of trading and the hoard of indicators I had on my charts, there is one indicator I feel stands apart from the rest. It’s not based on price and so represents an additional dimension on which to make decisions. I also think it is a very close relative of tape reading. In this article, we will look at some of the basics of using Cumulative Delta.
The Delta Theory Simplified
For a trade to occur in the markets, we need two things - a buyer and a seller. Price does not move down because there are more buyers than sellers. This is impossible, for every buyer there must be a seller. Price moves down when sellers are aggressive and buyers believe that sellers are willing to settle for a lower price. After all, why buy for $10 when you think you’ll be able to buy for $9 later?
Not all buyers and sellers are equal. For example, liquidity providers get paid to buy and sell using limit orders. Some people enter a trade to hedge a position in another market. Some buyers and sellers have firm conviction about market direction and some don’t. Some will sell short hoping to buy back at a lower price later and some simply don’t care.
If we look at a DOM, we will see bids and offers. These are limit orders waiting to be ‘hit’. If no-one does any hitting, then nothing happens. If we only had limit orders, chances are we wouldn’t see much action. Buyers would want sellers to come down to them and sellers would want buyers to come up to them and very little trading would take place (Yes, I am simplifying this). Enter the market order. A market sell order will trade with the highest bid and a market buy order will trade with the lowest offer. For users of cumulative delta, a market order is considered aggressive and a limit order is considered as passive. The action of a person hitting the bid or offer is considered one of more urgency.
The Cumulative Delta calculation is Market Buy Orders – Market Sell Orders. If the Cumulative Delta is positive, then we have more aggressive buyers. If it is negative, we have more aggressive sellers. This is the basis of delta analysis.
Flaws in the theory
The reality is that ‘aggression’ in the form of Limit orders is just as valid as aggression in the form of market orders. For instance, an iceberg order on the bid that absorbs all market sell orders is an aggressive action. Limit orders can hold the market but they can’t really push the market up. To ignore limit orders is to presume that large institutional traders always enter and exit with market orders. There is a trading trainer out there that claims institutional traders do just that. A few minutes looking at the DOM will show this is not the case.
So why isn’t it useless?
Given that market orders are not the only form of aggression, you’d be forgiven for thinking that Cumulative Delta was of no value. Over time, you will see this is not the case. For example, if you watch a range day on the ES (e-Mini S&P 500), you will see that on those days where the market closes near to where it opened, the delta does the same thing. It is common sense that in a market that is moving quickly in one direction, people are entering at market. At these times limit orders simply won’t get filled. Observation shows us that Cumulative Delta does indeed have its uses.
What to look for
Cumulative Delta isn’t something you can use to give objective, rules based signals. You can’t just jump in when there’s a divergence between price and delta. Cumulative Delta is similar to the art of Tape Reading in that it helps to paint an overall picture of what is happening. Cumulative Delta will help you make trading decisions but it shouldn’t be the only factor.
The key consideration is that Cumulative Delta will generally move with the price and when it doesn’t, it is time to pay attention.
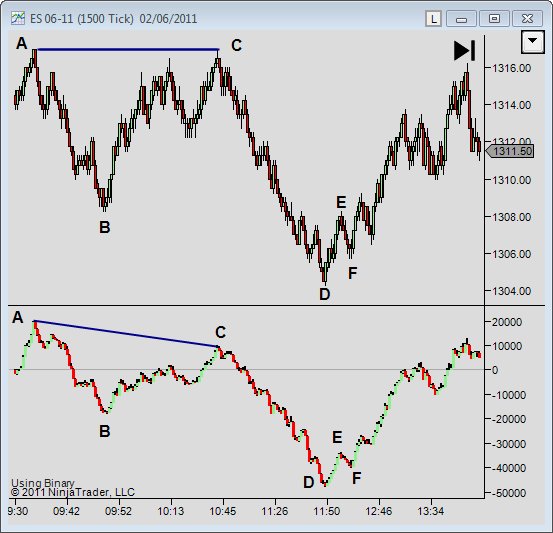
Fig 1.0 – e-Mini S&P 500, Price and Cumulative Delta charts.
In the above screenshot, we can see that from points A to B, delta was moving with the price. In this case, there is very little that delta adds to the picture, although delta helped us to see the lack of buying participation in the pullbacks. From B to C the price move is good but the move in delta looks quite lethargic. We can see that we got to point C with much less participation. As a bonus, we can also see that a lot of players joined in that move up right at the end, I am sure I am not the only one that has been a buyer at the end of an up move but suffice to say that this helps tremendously to the downside (but that’s for another article). Overall from B to C, Cumulative Delta is telling us the move is weak.
From C to D, Delta moved with price. There is nothing that would have confirmed a buy on the way down, quite the contrary, the small pullbacks look weak. The move from D to E is interesting, we had the first major push upwards for a while and we saw good participation from buyers, with roughly 13,000 more market buys than sells. If we put this in perspective of the overall move down, this is a decent relative shift in Delta. The pullback from E to F, whilst perhaps a little scary on the right edge would have been a good choice for a long trade.
Summary
Whilst delta theory has a few holes in it, it does seem to play out in the real world. The key is to use it as an additional decision making factor. Generally speaking, I will be looking for the following:
- Delta confirming a move. Delta and price both doing the same thing.
- Delta moving and price not moving in the same direction. For example, if we see Delta move down but price not move down, then there is selling but it is having no reaction. There are more people selling at market than buying at market but limit orders are absorbing this. If selling doesn’t move price down, then we can expect price to go up.
- Price moving but Delta not moving in the same direction. If price moves without much participation, then it helps us to confirm a trade in the opposite direction. Still, you do need a valid reason to trade in the opposite direction other than just the Delta. Delta on its own is not enough. If you have an expectation that an up move will end in a certain place and the buyers are not participating strongly up to that point, then it helps to validate your premise that price will roll back down.
Peter Davies can be contacted at Jigsaw Trading
Last edited by a moderator: