Moneylender
Legendary member
- Messages
- 5,693
- Likes
- 369

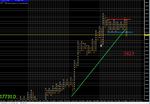
that supp is 2070-2073 area
2068 is a prev breakout area aquaSeems to be quite strong here, maybe a bottom!
Maybe not

That held and we got a decent rally2068 is a prev breakout area aqua
2086-2090 prev breakdown area
That held and we got a decent rally


there is always directionMorning, no direction so far.

looking like it wants to get some supp in 10800 areathere is always direction
at this point it will just be moving to test supp/res