Trading using Bookmap heatmap

21/01/20 trading $NVAX. Buyers exhausted in 10$ and got soaked, short
 

Attachments

  • NVAXDXFEED_screenshot_20200121_125116_195.png
    NVAXDXFEED_screenshot_20200121_125116_195.png
    167.5 KB · Views: 165
  • NVAXDXFEED_screenshot_20200121_135810_719.png
    NVAXDXFEED_screenshot_20200121_135810_719.png
    211.3 KB · Views: 142
21/01/20 trading $VIVE. Buyers in 1$ at pre market, push to 1.4 and got soaked by sellers, vol. went off, long & short
 

Attachments

  • VIVEDXFEED_screenshot_20200121_135836_958.png
    VIVEDXFEED_screenshot_20200121_135836_958.png
    131.6 KB · Views: 133
23/01/20 trading $NVAX. Resistance at open in 7.9, relatively small liquidity but no buyers so imbalance on the tape and good for short
 

Attachments

  • NVAXDXFEED_screenshot_20200123_143208_299.png
    NVAXDXFEED_screenshot_20200123_143208_299.png
    102 KB · Views: 164
23/01/20 trading $NNVC. High liquidity of buyers at 4.5, imbalance on the tape for buyers so good for a continuation up, long
 

Attachments

  • NNVCDXFEED_screenshot_20200123_144008_699.png
    NNVCDXFEED_screenshot_20200123_144008_699.png
    113.9 KB · Views: 134
23/01/20 trading $NVAX. Tested again 8$ level with still high sellers liquidity, short
 

Attachments

  • NVAXDXFEED_screenshot_20200123_144518_641.png
    NVAXDXFEED_screenshot_20200123_144518_641.png
    177.8 KB · Views: 151
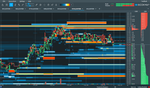
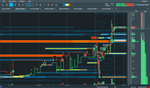
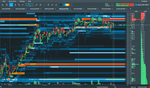
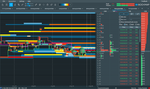
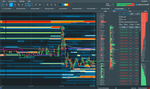
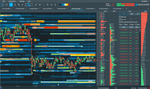
23/01/20 trading $MRNA. High buyers liquidity in 21.75 and imbalance on the tape for long. Buyers got soaked on 22.5$ several times which gives good resistance signal for short
 

Attachments

  • MRNADXFEED_screenshot_20200123_153340_211.png
    MRNADXFEED_screenshot_20200123_153340_211.png
    222 KB · Views: 134
  • MRNADXFEED_screenshot_20200123_153211_852.png
    MRNADXFEED_screenshot_20200123_153211_852.png
    202.4 KB · Views: 130
  • MRNADXFEED_screenshot_20200123_153023_207.png
    MRNADXFEED_screenshot_20200123_153023_207.png
    203.3 KB · Views: 157
  • MRNADXFEED_screenshot_20200123_151930_789.png
    MRNADXFEED_screenshot_20200123_151930_789.png
    196.2 KB · Views: 126
23/01/20 trading $TWMC. High liquidity of sellers at 7.8$, after resistance in 8$, short
 

Attachments

  • TWMCDXFEED_screenshot_20200123_163347_326.png
    TWMCDXFEED_screenshot_20200123_163347_326.png
    319.8 KB · Views: 152
24/01/20 trading $NNVC. Buyers at 6.09$ high liquidity and no sellers on pre market, big imbalance, long
 

Attachments

  • NNVCDXFEED_screenshot_20200124_142842_480.png
    NNVCDXFEED_screenshot_20200124_142842_480.png
    143.4 KB · Views: 134
Correct23, this is my first time ever seeing heat map charts. Those are interesting indeed.

Do you prefer using heat maps? Can you think of any pros or cons?

How did you decide to start using heat maps? Are they commonly used?

Heatmaps look confusing at first. How long did it take to get comfortable understanding what you are even looking at?

Do you use any special computer monitor for that?

Are you primarily trading medical company stocks? If so, why do you chose to focus on that subject?

What charting software are you using that supports heatmaps?
Hey Bubba, greetings.
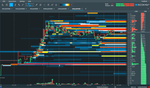
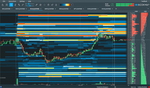
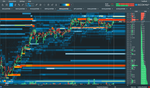
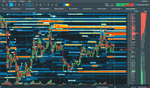
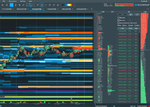
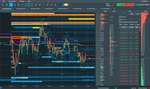
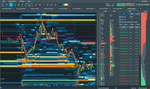
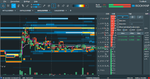
I use Bookmap heat map for a year and a half now approximately. I encounter this tool through a guy that I was studying his stuff. It's a great tool that is not hard to handle- very good for beginners, it displays the market auction in a more vivid way than the classic DOM. Of course I don't use only that, it's supplementary to my other tools. A pros is that it shows where the big players are, where they really stacks their orders, and that can give a good ideas where are the S/R levels. It also shows hidden players that you can't see on L2 and when algos are getting in. It shows also the historical liquidity levels so in that sense it's better the L2. Cons can be to someone that relay only on the heatmap, cause it's less easy to see patterns, also it don't have indicators like the regular softwares.
The minute I sew it I realised its value and started to use that. The software is not existing long time relatively but as to the time a lot use it for my knowledge.
I trade all the stocks bur prefer medical and biotech companies cause they work better with my strategies.
I'm using also IB and TOS, for trading and TA and screeners.
 
12/02/20 trading $TRXC. Big seller in pre market at 1.57$ with no bidders to hold him, short
 

Attachments

  • TRXCDXFEED_screenshot_20200212_123358_162.png
    TRXCDXFEED_screenshot_20200212_123358_162.png
    122 KB · Views: 136
10/02/20 trading $TNAV. High liquidity at 6.5$, half dollar number, buyers got soaked once, not enough power to go through 6.5, short
 

Attachments

  • TNAVDXFEED_screenshot_20200210_145601_671.png
    TNAVDXFEED_screenshot_20200210_145601_671.png
    171.1 KB · Views: 157
10/02/20 trading $NVAX. Great stock to trade, sellers in 7.25$, buyers got soaked twice, big seller came in at 7.2$, short
 

Attachments

  • NVAXDXFEED_screenshot_20200210_160503_170.png
    NVAXDXFEED_screenshot_20200210_160503_170.png
    176.5 KB · Views: 154
11/02/20 trading $AMKR. High liquidity at 15$ makes a big resistance, big sellers jump in at 14.6$ to refuel the short
 

Attachments

  • AMKRDXFEED_screenshot_20200211_144413_988.png
    AMKRDXFEED_screenshot_20200211_144413_988.png
    231.7 KB · Views: 140
12/02/20 trading $DTSS. Big liquidity level at 4$, fast play at open, short
 

Attachments

  • DTSSDXFEED_screenshot_20200212_143521_477.png
    DTSSDXFEED_screenshot_20200212_143521_477.png
    180.2 KB · Views: 135
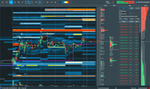
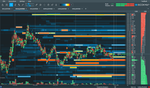
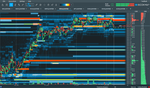
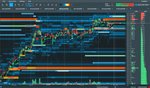
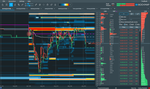
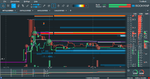
12/02/20 trading $ADVM. High liquidity at 15$, rejected first for a short, go back up get rejected small and buyers lose all the strength, so in the next liquidity level get flush.
 

Attachments

  • ADVMDXFEED_screenshot_20200212_143823_811.png
    ADVMDXFEED_screenshot_20200212_143823_811.png
    163.4 KB · Views: 161
  • ADVMDXFEED_screenshot_20200212_145917_107.png
    ADVMDXFEED_screenshot_20200212_145917_107.png
    200.4 KB · Views: 146
13/02/20 trading $CAN. Can play it both long and short, big buyer at 6.5$ push at open hype, big sellers form resistance at 7.5, absorb the buyers and flush
 

Attachments

  • CANDXFEED_screenshot_20200213_194947_105.png
    CANDXFEED_screenshot_20200213_194947_105.png
    215.7 KB · Views: 144
14/02/20 trading $GNPX. Going to midday, sellers stack at 5.7, buyers with no strength, short
 

Attachments

  • GNPXDXFEED_screenshot_20200214_163604_208.png
    GNPXDXFEED_screenshot_20200214_163604_208.png
    214.9 KB · Views: 151
18/02/20 trading $AIHS. Resistance level of sellers at 1.2$ with no buyers pushing, short
 

Attachments

  • AIHS@DXFEED_screenshot_20200218_151325_927.png
    AIHS@DXFEED_screenshot_20200218_151325_927.png
    115 KB · Views: 138
18/02/20 trading $MITO. Big sellers at 3.45$, pre market, refueled at open at 3.18$, short
 

Attachments

  • MITO@DXFEED_screenshot_20200218_151417_855.png
    MITO@DXFEED_screenshot_20200218_151417_855.png
    73.4 KB · Views: 196
  • MITO@DXFEED_screenshot_20200218_151429_810.png
    MITO@DXFEED_screenshot_20200218_151429_810.png
    117.3 KB · Views: 139
Top