N Rothschild
Legendary member
- Messages
- 5,296
- Likes
- 603
No one on this forum talks about tick charts, they are far more powerfull than time based charts!
Here is a trade that just happened. I didn't take it as i dont day trade anymore, but im bored so thought i would show others.
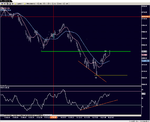
On the 512tick we have prices making new lows, with rsi deivergence. not bad technical set up right?
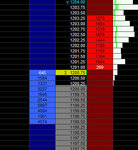
well add in the matrix, first screen shot you can see how much more there was on the bid than the offer. there was quite alot of buyers interested in this new lows (and lower). couple that with the divergences on the rsi and the tick chart. a good long set up!
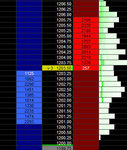
The exit, the offer was pretty weak up untill about 1203 which is where you could have bailed as more selling interest came in. the market has since pulled back from here.
not bad 25-30 pips for very a very easy set up. you can do this ALL day long.


