Naz
Experienced member
- Messages
- 1,391
- Likes
- 25
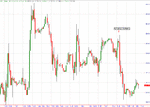
Naz said:Here are my entries and exits on the 15% Corus move, they were both taken by applying intra day trading skills to a multi day swing trade.
Alan
Naz said:.....................As well as day trading the US, I swing trade stocks on the UK market where i read the intra day activity to understand how it fits into a multi day swing trade. This gets me in and out whilst EOD swing traders are not quite sure whats going on.....................
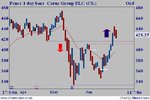
barjon said:alan
not too confusing for eod players surely?
the earlier short (white line to white line) was pretty straightforward and the second line exit was a good long entry point if not reaching earlier support is your bag.
it'd be interesting to see the intraday chart activity that led to your entry and exit points if you've still got it to hand.
good trading
jon
barjon said:the earlier short (white line to white line) was pretty straightforward and the second line exit was a good long entry point if not reaching earlier support is your bag.
St Lucia is fabulous - so luscious, one of the best Carribean islandsNaz said:Yes, i welcome anyone posting here.
I've been absent firstly becuase i was in the St Lucia on holiday
.
Their loss is our gain, if we can see more of your postings hereNaz said:and then i was told that Via-trader wanted to become a scanning only site. So i had no choice but to leave at the end of this month along with the other traders.
.
...my wifes Aunt had red knickers on today which means its going down!
There is also a third option which NAZ could be refereing to 😱 😱Trader333 said:Did you mean the knickers or did you mean the market 🙂
Paul
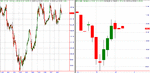
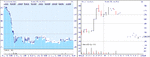
Naz said:Here is a UK chart, look at the end of day bars and then work out what they truly should read by studying the intra day moves.
The intra day charts tell whats really going on, the end of day bars say something completely different on some days.
Naz said:Hi Tim,
I realise EOD charts are easier to read. I fully understand that. However a while back i was interested when two guys came to me and were EOD traders and wanted to understand intra day movement so they could put it together with their EOD studies. Afterwards i thought you guys have got a point. So this was one reason ,only one that i started to look at a full day's intra day movement and see how it fitted into the EOD cycle. WOW it told you so much.
I then noticed in the UK that how on occasion a EOD bar paid no relation to what happened intra day and i'd thought pitty the poor trader who made his/her decision of that bar.
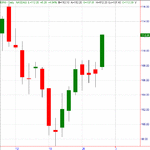
I attach a chart again of an intra day chart next to end of day chart on a UK stock. On 20/6 intra day clearly shows the stock opens at the highs and closes at it lows and goes down all day. EOD bar shows it as an up day closing at its highs. The exact opposite.
The next day 21/6, intra day shows the stock continues its trend down, only the EOD bar shows it as a small up day. The exact opposite.
The next day intra day shows it as a slightly up day, EOD shows it as a down day. The opposite.
There maybe some reason for the discrepancy and i would be only to happy to listen to anyone who could explain what it is. Other than that its confusing EOD chart readers and something needs to be done about the structure of the charts to fully show whats truly occurring.
Alan