Hello folks, my trading method is as described in the title. Support and resistance drives market direction so it follows that understanding and recognizing these levels is vital when trading any market. My market of choice will be the Dow (US30). I will be starting small, spread betting £1 per point using IG index.
You are using an out of date browser. It may not display this or other websites correctly.
You should upgrade or use an alternative browser.
You should upgrade or use an alternative browser.
F
fibo_trader
Hello folks, my trading method is as described in the title. Support and resistance drives market direction so it follows that understanding and recognizing these levels is vital when trading any market. My market of choice will be the Dow (US30). I will be starting small, spread betting £1 per point using IG index.
Won't work for at least this year. Donald Trump creates all support and resistance level with one or 2 at the most, tweets. Study him, its way better - easy in is when Ivanka buys and sells. She knows when the tweets come out and is positioned already. If right leg crosses left go Long and vice versa
Interesting reply 'fibo' but as long as there are support and resistance levels I don't care who provides them.Won't work for at least this year. Donald Trump creates all support and resistance level with one or 2 at the most, tweets. Study him, its way better - easy in is when Ivanka buys and sells. She knows when the tweets come out and is positioned already. If right leg crosses left go Long and vice versa
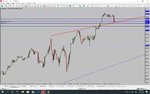
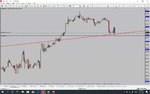
My first trade arrives when fundamental news drove the market down (Asian virus is spreading) Although I don't trade the news as such it's good to keep one eye on it. I already had this support line drawn in (Red line) and being rather an aggressive trader (sometimes too aggressive) I entered at 29206 with a stop at 29176. So far at time of posting it's going my way but of course by the time you read this I may well have been stopped out, time will tell.
4 Hour Chart and 1 hour Chart
4 Hour Chart and 1 hour Chart
Attachments
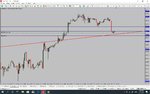
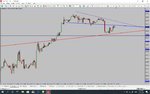
The price broke through the descending blue resistance line (in above chart) but reacted strongly when reaching the next resistance level at 29263 (blue horizontal line) crashing down wiping out all my gain. My support (red) line still holds with the price hitting and bouncing up again showing the validity of that level....for the moment.
Attachments
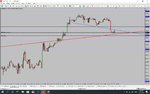
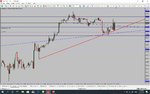
I think knowing where to place your stoploss is as important as knowing where to enter a trade. I placed my stop at 29176 just below what I considered to be an important support level at 29182 (blue line). Had I placed my stop a few pips below the red support level I would have been taken out for a loss. So for an extra 10 pips or so I remain in the trade....for now.
Attachments
D
Dowser
Why the two accounts?
Yeah I just spotted that. I joined T2W way back but forgot my login details so registered another account. Seems the old account sprang up somehow confusing things when I log in. I'll delete one, or maybe that will delete some posts. I'll just continue with this account.Why the two accounts?
D
Dowser
Fair enough, good luck with the threadYeah I just spotted that. I joined T2W way back but forgot my login details so registered another account. Seems the old account sprang up somehow confusing things when I log in. I'll delete one, or maybe that will delete some posts. I'll just continue with this account.
Exit Trade for 50 pips
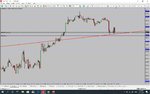
It was pretty wild ride but one that came good in the end. I decided to take profit when the price ran into a resistance level show in the chart as a thick blue line. It may well go up from here but I'm willing to wait for the US open in about an hour or so before entering another trade.
It was pretty wild ride but one that came good in the end. I decided to take profit when the price ran into a resistance level show in the chart as a thick blue line. It may well go up from here but I'm willing to wait for the US open in about an hour or so before entering another trade.
Attachments
F
fibo_trader
Won't work for at least this year. Donald Trump creates all support and resistance level with one or 2 at the most, tweets. Study him, its way better - easy in is when Ivanka buys and sells. She knows when the tweets come out and is positioned already. If right leg crosses left go Long and vice versa
Pretty much everybody is Short today, Ivanka is Long
Good luck with thatPretty much everybody is Short today, Ivanka is Long
F
fibo_trader
Good luck with that
Not me. I'm not playing. Its Ivanka. There is a chart being done which shows historical evidence of how often Ivanka gets the tweets right? Chart should be ready by March this year.
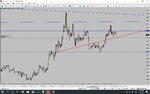
The market opened in the US and exploded up with a long 5 minute candle. If there's one thing I've learnt from many years of trading it's never to jump into a trade, I always let the price come to what I see as a strong support/resistance level. On the one hour chart I have drawn in my new support level (thick red line) and entered long at 29244 with a stop loss at 29212. The trade at the moment is going my way and we'll see what happens in the next few hours.
Attachments
Thanks for the trading adviceNot me. I'm not playing. Its Ivanka. There is a chart being done which shows historical evidence of how often Ivanka gets the tweets right? Chart should be ready by March this year.
F
fibo_trader
Thanks for the trading advice
Thanks for the trading advice
Welcome! Your TA or FA methods will still be used but knowing how the big guns are playing the game is where the real juice is at. And Ivanka has been and is currently the TRADING GODDESS, having blown George Soros out the window last year. DIA/SPY/QQQQ
But here's the thing: nobody, I mean nobody, not even Ivanka can hide their footprint on the Volume. Once you get her style and parameters its much easier to follow. It is nevertheless an Art. Hope her daddy wins again then we have 4 more years of TA not required, only tweets.
My 2 cents
F
fibo_trader
Since you're a Support/Resistance guy, don't ignore the bigger picture even though you're on 1H. Smack at resistance, big time resistance

HI Ho Silver
Although this is a thread about trading the Dow I just want to show an example of how looking for and recognizing support and resistance levels can make pips. While waiting for the US markets to open I was watching Silver dropping like a stone and I was looking for a strong support level to enter long. Take a look this daily and hourly chart. My support level is the thick red line. So far this Silver trade is going my way and we'll see what happens in the next few hours.
Although this is a thread about trading the Dow I just want to show an example of how looking for and recognizing support and resistance levels can make pips. While waiting for the US markets to open I was watching Silver dropping like a stone and I was looking for a strong support level to enter long. Take a look this daily and hourly chart. My support level is the thick red line. So far this Silver trade is going my way and we'll see what happens in the next few hours.
Attachments
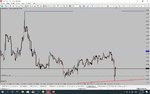
Thanks for that, I always look at the bigger picture not just the daily but also the weekly and monthly charts.Since you're a Support/Resistance guy, don't ignore the bigger picture even though you're on 1H. Smack at resistance, big time resistance
View attachment 273226
Similar threads
- Replies
- 24
- Views
- 7K
- Replies
- 1
- Views
- 6K
- Replies
- 4
- Views
- 2K
- Replies
- 21
- Views
- 5K