You are using an out of date browser. It may not display this or other websites correctly.
You should upgrade or use an alternative browser.
You should upgrade or use an alternative browser.
JillyB
Established member
- Messages
- 791
- Likes
- 38
hornblower said:Hi JillB
I have been reading this thread with interest
please can you tell me what you are trading so I can have a look?
5 minute charts on the Cable with CMC data.
JillyB
Established member
- Messages
- 791
- Likes
- 38
tunnel1x1 said:JillyB,
Would it make sense and comply with Darvas to place your stop just below the top of the box, rather than the opposite side, on the theory that a bona fide breakout should not come back inside the box? If price comes back inside the box after a breakout, can you still say at that point that the breakout should be traded. Doing it that way would greatly reduce the amount of the risk.
With the method Darvas used, he took the opposite side of the box as being his stop until the stock showed that it was capable of trading totally within the new upper range and then he moved his stop up.
This is the same sort of thing as I'm trying to achieve. Initially the stop is the other side of the box and the majority of time, when I'm just looking for ony 5 pip profit it wil stay there. However if the Cable moves with some momentum then I consider looking at a 2 min chart and moving the stop up to the low (in an uptrend) of the previous candle. This way the stop trails up after the price locking in the profit.
As we are intraday trading the stops need to be addressed slightly differently to how Darvas used them on stock - I think.
JillyB
Established member
- Messages
- 791
- Likes
- 38
a_gnome said:Hi Jilly,
Firstly, thanks for your clarity and openess on how you trade this method.
Going back if I may to the definition of the high, how many bars do there have to be for it to be a high? You say that being a higher high than the previous 1 bar is not enough, could you say how many bars back it must be higher than?
If I were to program this up in TradeStation for example I might define the high as being higher than the last N bars before it and having two lower bars after it (being candles 2 and 3 of the potential box). What might a minimum value of N be for you to feel that it was a genuine high rather than a blip? Also can these prior bars (and also bars 2 and 3 of the box) have equal highs or do they have to be lower?
Definition of a high, that's a good one. Hmmm.....
It's something that I can look at and assess, but I've never had to quantify before. I will say three higher highs - as a start. But I want to look at this in more detail.
I appreciate what you're saying about programming it into a system, but as I've never considered this before, give me some more time to look into it and I will come back to you with an answer.
To answer your question about bars 2 and 3, they can have equal or lower highs. The crucial thing is that they don't have higher highs.
The low can be set from the lowest low of 1, 2 or 3, but must be maintained until 5, otherwise it is reset.
The high of 1 must be maintained until 5 has been confirmed.
Hello,
This is my first post. And did a Google Search for Darvas Box and found this place. Although, I am not a Forex trader I am a E-mini trader and investigating the use of the DB method. I wasn't interested in it because the stops appeared to be to far away for my comfort.
With some more research have stumbled onto something that may help change that. I am still just investigating it. So bear this in mind.
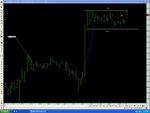
The idea comes from Robert Krausz's book "A W.D. Gann Treasure Discovered". He calls it the HiLo Activator. Esenually it is only two 3 period Moving Averages. One is based on the high and the other is based on the low. For a long, the stop is a close below the Low moving average. For a short, the stop is a close above the high moving average.
Alexis C. Montenegro who is in the Esignal forum coded this up and calls it the HiLo Activator which only plots if the prices are closing above the low indicator or price are plotting below the high indicator. One can do the same thing with two 3 period MA's.
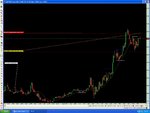
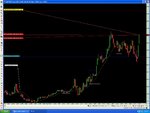
Some of you may be interested as well. Here is a image to look at.
Russ
This is my first post. And did a Google Search for Darvas Box and found this place. Although, I am not a Forex trader I am a E-mini trader and investigating the use of the DB method. I wasn't interested in it because the stops appeared to be to far away for my comfort.
With some more research have stumbled onto something that may help change that. I am still just investigating it. So bear this in mind.
The idea comes from Robert Krausz's book "A W.D. Gann Treasure Discovered". He calls it the HiLo Activator. Esenually it is only two 3 period Moving Averages. One is based on the high and the other is based on the low. For a long, the stop is a close below the Low moving average. For a short, the stop is a close above the high moving average.
Alexis C. Montenegro who is in the Esignal forum coded this up and calls it the HiLo Activator which only plots if the prices are closing above the low indicator or price are plotting below the high indicator. One can do the same thing with two 3 period MA's.
Some of you may be interested as well. Here is a image to look at.
Russ
Attachments
JillyB
Established member
- Messages
- 791
- Likes
- 38
russ1709 said:Hello,
This is my first post. And did a Google Search for Darvas Box and found this place. Although, I am not a Forex trader I am a E-mini trader and investigating the use of the DB method. I wasn't interested in it because the stops appeared to be to far away for my comfort.
With some more research have stumbled onto something that may help change that. I am still just investigating it. So bear this in mind.
The idea comes from Robert Krausz's book "A W.D. Gann Treasure Discovered". He calls it the HiLo Activator. Esenually it is only two 3 period Moving Averages. One is based on the high and the other is based on the low. For a long, the stop is a close below the Low moving average. For a short, the stop is a close above the high moving average.
Alexis C. Montenegro who is in the Esignal forum coded this up and calls it the HiLo Activator which only plots if the prices are closing above the low indicator or price are plotting below the high indicator. One can do the same thing with two 3 period MA's.
Some of you may be interested as well. Here is a image to look at.
Russ
Hi Russ,
Welcome to T2W and to this thread.
What you're proposing sounds interesting, but can you give us a little more information. Are they SMA's or EMA's? You say they are 3 period settings one based on the high and the other based on the low, but is there any vertical shift applied to this?
Is this to use JUST as a stop, or as a confirmtion to enter the trade as well?
JillyB
Established member
- Messages
- 791
- Likes
- 38
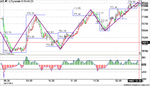
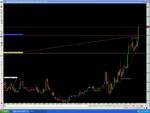
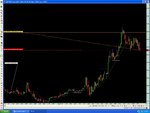
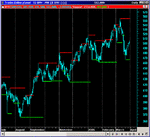
Ok, Darvas box breakout on 5 min chart at 9.30am
Used a trailing stop on a 2 minute chart to lock in profits. 9.34 candle locked in +1 pip (after spread) 9.36am candle locked in +8pips (after spread). Then stopped out.
But +8 pips is ok and the method gave me more than the 5 pips I would usually have taken. 😀
Used a trailing stop on a 2 minute chart to lock in profits. 9.34 candle locked in +1 pip (after spread) 9.36am candle locked in +8pips (after spread). Then stopped out.
But +8 pips is ok and the method gave me more than the 5 pips I would usually have taken. 😀
JillyB said:Ok, Darvas box breakout on 5 min chart at 9.30am
Used a trailing stop on a 2 minute chart to lock in profits. 9.34 candle locked in +1 pip (after spread) 9.36am candle locked in +8pips (after spread). Then stopped out.
But +8 pips is ok and the method gave me more than the 5 pips I would usually have taken. 😀
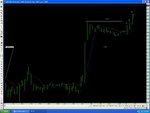
Jilly,
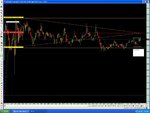
8 pips is ok, but not very much. Look at the USD/CHF chart this morning, and you will se what I mean... 😉
JillyB said:Hi Russ,
Welcome to T2W and to this thread.
What you're proposing sounds interesting, but can you give us a little more information. Are they SMA's or EMA's? You say they are 3 period settings one based on the high and the other based on the low, but is there any vertical shift applied to this?
Is this to use JUST as a stop, or as a confirmation to enter the trade as well?
JillyB,
The HiLo indicator is based on SMA's with no offset that one could use as only a stop.
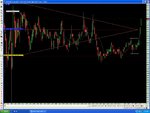
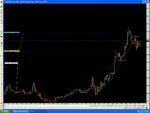
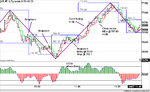
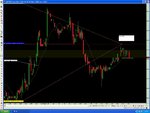
Also some thing else I am observing is, that if the you have an established trend by both the Gann Swing and the 14 period CCI (or your favorite method) and you haven't fell out of the box, this may be a low risk long snapback entry (see example). The same but revered for short.. In this case one may ignore the HiLo and use the bottom of the box for the stop.
I think everyone will agree, that one needs to know in advance where to get out if the trade doesn't go your way and where to get out with a profit.
This has not been test to any extent. This just some observations.
See this example.
Russ
Attachments
Last edited:
VSATrader
Guest
- Messages
- 160
- Likes
- 26
VSATrader
Guest
- Messages
- 160
- Likes
- 26
If anyone would like a support and resistance indicator for Metastock, then try this one as it's close to Darvas without being Darvas:
MIGHT ONLY WORK ON DAILY CHARTS
Support & Resistance - Peaks/Troughs
{ Support & Resistance v2.0 }
{ Plots support/resistance levels based on
normal or hindsight peaks/troughs }
{ ŠCopyright 2004 Jose Silva }
{ http://www.metastocktools.com }
{ User inputs }
plot:=Input("[1]Support, [2]Resistance, [3]Both, [4]Combination",1,4,3);
x:=Input("use [1]High/Low, [2]Close",1,2,1);
type:=Input("Type: [1]Normal, [2]Hindsight",
1,2,1);
depth:=Input("Peak/Trough minimum depth (0~50%)",0,50,5);
pds:=Input("Peak/Trough period base (3~252)",
3,252,5);
{ Price field }
xHi:=If(x=1,H,C);
xLo:=If(x=1,L,C);
{ Non-hindsight Support/Resistance }
Hi:=
(HHV(xHi,pds-1)>xHi)>Ref(HHV(xHi,pds-1)>xHi,-1);
HiVal1:=ValueWhen(1,Hi,Ref(xHi,-1));
Lo:=
(LLV(xLo,pds-1)<xLo)>Ref(LLV(xLo,pds-1)<xLo,-1);
LoVal1:=ValueWhen(1,Lo,Ref(xLo,-1));
Hi:=Hi AND HiVal1>LoVal1*(1+depth/100);
Lo:=Lo AND LoVal1<HiVal1*(1-depth/100);
supp:=ValueWhen(1,Lo,Ref(xLo,-1));
res:=ValueWhen(1,Hi,Ref(xHi,-1));
comb:=If(BarsSince(Hi)<BarsSince(Lo),res,supp);
{ Hindsight Support/Resistance }
pkH:=PeakBars(1,xHi,depth);
trH:=TroughBars(1,xLo,depth);
suppH:=Trough(1,xLo,depth);
resH:=Peak(1,xHi,depth);
combH:=If(pkH<trH,resH,suppH);
{ Chosen Support/Resistance }
supp:=If(type=1,supp, suppH);
res:=If(type=1,res,resH);
comb:=If(type=1,comb,combH);
{ Plot on price chart }
If(plot=1,supp,If(plot=2,res,
If(plot=3,res,comb)));
If(plot=1,supp,If(plot=2,res,
If(plot=3,supp,comb)))
Attachments
Last edited:
JillyB said:Hi Russ,
Welcome to T2W and to this thread.
What you're proposing sounds interesting, but can you give us a little more information. Are they SMA's or EMA's? You say they are 3 period settings one based on the high and the other based on the low, but is there any vertical shift applied to this?
Is this to use JUST as a stop, or as a confirmtion to enter the trade as well?
Hi JillyB, hi Russ
There's a good explanation of Robert Krausz's HiLo Activator in one of the Fibonacci Trader Journals (journal No.2 I think) at www.fibonaccitrader.com together with illustrations of entry and exit rules combined with Gann swing chart rules.
I've always felt that the positions of Darvas tops and bottoms are very similar to the turning points of a Gann 3-day swing chart; they both show essentially the same information but are just presented in different ways.
Similar threads
- Replies
- 9
- Views
- 7K