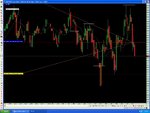
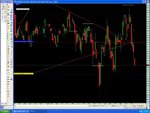
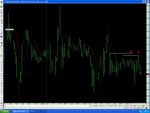
Trading the Darvas Method

The smaller box within the larger one didn't hold, as it's top was breached.

But now we have a breakout through the top of the box at 10.50am (within a trading 'time zone).

Managed to get in at 1.7856 so looking for 1.7864 to take 5 pips with 3 pip spread.

Lets see how we go.
 
Thanks Jill, hope using the time zone as a filter works out for you.
Has a darvas trade been trigerred in your zone?
 
JillyB said:
The smaller box within the larger one didn't hold, as it's top was breached.

But now we have a breakout through the top of the box at 10.50am (within a trading 'time zone).

Managed to get in at 1.7856 so looking for 1.7864 to take 5 pips with 3 pip spread.

Lets see how we go.
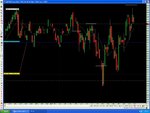
Second candle formed a doji and now it's heading south again, so perhaps not such a good trade after all.

Perhaps I should have taken notice of the support/resistance levels intraday on this one, as it was close to one. But there again resistance is only resistance until it is broken.
 
Hoping Bernanke's testimony today 15.00bst ( coincides with your timezone) provides much needed inspiration for the fx pairs.
 
indexgold said:
what do you base you time zone on jily

Only previous data of when a box was broken. Each day I record the time the breakout occurs and then after a while started to notice that these tend to happen at specific times.

The trades which were failures happened in between these times (generally). Only 4 failures in 51 trades so far. Though this current one could be no: 5. :eek:
 
Darvas just formed
 

Attachments

  • darvas.JPG
    darvas.JPG
    151.3 KB · Views: 268
Hi JillB
I have been reading this thread with interest
please can you tell me what you are trading so I can have a look?
 
Mr.Black said:
Darvas just formed

Can't quite see where your box base is. If it's the dotted line, then that's incorrect, it should be the base of the second candle - the one following the doji - as this has the lower low.

If so then yes the base (1.7846) has just been broken. This looks quite strong as the previous box failed to get passed the resistance at 1.7861 and formed a double top - good reversal signal.

Perhaps based on this I do need to incorporate support and resistance levels into the analysis of the Darvas box and see if that makes for more positive trades.
 
JillyB said:
Can't quite see where your box base is. If it's the dotted line, then that's incorrect, it should be the base of the second candle - the one following the doji - as this has the lower low.

If so then yes the base (1.7846) has just been broken. This looks quite strong as the previous box failed to get passed the resistance at 1.7861 and formed a double top - good reversal signal.

Perhaps based on this I do need to incorporate support and resistance levels into the analysis of the Darvas box and see if that makes for more positive trades.
The base is my entry +1 pip
 

Attachments

  • base.JPG
    base.JPG
    155.4 KB · Views: 238
profit taken +6 pips :cheesy: :cheesy:
 

Attachments

  • Profit.JPG
    Profit.JPG
    166.4 KB · Views: 242
Mr.Black said:
The base is my entry +1 pip


Good trade, you should have been able to take 10 pips off that one.

As for me, not so good got out midway down the box for a 13 pip loss. :(
 
The only thing with darvas box is, everyone interprets them differently ... to me it looks ok what Mr Black drew, but then again 1.8742 low also looks ok to draw a box.
 
JillyB said:
Good trade, you should have been able to take 10 pips off that one.

As for me, not so good got out midway down the box for a 13 pip loss. :(
Yes if you scalp currency futures on CME the spread is 1 pip not 4 pips :cry: :cry:
 
indexgold said:
its usaly 2 pips on cable with cmc,,,,eur is 1 pip most of the time...this is what i trade
If you trade between Bid/Ask you can cut the spread :devilish: :devilish:
 
In this particular trade there is resistance 1.7863. So the market respond
and usually People stack stop orders below #3 point which is logical target
 

Attachments

  • darvas30.JPG
    darvas30.JPG
    151.5 KB · Views: 320
I'm forward testing using Oanda's bid chart with a 3 pip spread on Cable and the win rate is less than JillyB's. I like the simplicity of Darvas, but the risk:reward on my testing of the 5 min timeframe doesn't suit me.

I'm going to begin to test with a moving average trend filter and trade only 'with the trend' breakouts to see if this helps increase the win rate, and to see if the trend momentum provides more trailing stop opportunities, beyond the initial 5 pip target.

The trend filter is an EMA on the 5min - if price is whipping around the average, no trades taken; if the EMA is rising with price above the EMA then trade long Darvas; EMA falling and price below, trade short Darvas.

Work in progress disclaimer applies.
 
JillyB said:
Actually no, there isn't anything.

True the R:R ratio is quite frightening, but we seem to have a high percentage of 5 pip wins that don't get totally turned around by the odd loss.

So I'm still going with the theory of the opposite side of the box being the stop at the moment. However I am reviewing this, to see if it can be reduced to say 50% of the box width when trading during the give 'time zones'.

I need to watch this first to see if, and how many times, I get stopped out on this when it would have gone on to be a winning trade.

It's all still work in progress.

JillyB,

Would it make sense and comply with Darvas to place your stop just below the top of the box, rather than the opposite side, on the theory that a bona fide breakout should not come back inside the box? If price comes back inside the box after a breakout, can you still say at that point that the breakout should be traded. Doing it that way would greatly reduce the amount of the risk.
 
JillyB said:
A box high can be the top of an uptrend, or the top of a bounce. It's taken as the high of the candle.

It's not a high formed within a downtrend sequence of candles. The sort where you get on candle on a 5 min chart that forms a higher high than the previous. This would not be a box top.

Once you have the high in place from the top of a bounce or uptrend then the box bottom is the low of the third candle (or second if this lower). If the box bottom is breached before candle 5 has formed, you can reset it and the new candle forming the base becomes candle 3 again.

Does this make sense?

Hi Jilly,
Firstly, thanks for your clarity and openess on how you trade this method.

Going back if I may to the definition of the high, how many bars do there have to be for it to be a high? You say that being a higher high than the previous 1 bar is not enough, could you say how many bars back it must be higher than?

If I were to program this up in TradeStation for example I might define the high as being higher than the last N bars before it and having two lower bars after it (being candles 2 and 3 of the potential box). What might a minimum value of N be for you to feel that it was a genuine high rather than a blip? Also can these prior bars (and also bars 2 and 3 of the box) have equal highs or do they have to be lower?
 
Top