Trading Russian and Other Emerging Market Equities and their derivatives

Severstal (SVST LI) - top pick in the sector.

Severstal (SVST LI) posted strong IFRS financials in 2Q10. POSITIVE. Severstal remains our top-pick – see Bloomberg link {NSN L8BWEN3PWT1C <GO>}, also attached. We consider the company’s 2Q10 financial statement as positive and confirm our BUY recommendation on the stock with a target price of $15.5/share. However, 2H10 is likely to be weaker as compared to 1H10 due to lower steel prices and fragile demand on rolled steel products. Nevertheless, its gold mining segment, which is gaining momentum, and high vertical integration into the production of coking coal and iron ore to some extent offset negative market developments. As for North America assets, in our view, temporary improvement may help the company to sell them. Key numbers here are:

· 2Q10 net income in line with our expectations. The company’s revenue increased by 35% q-o-q to $4,245 mn, EBITDA doubled q-o-q to $955 mn. 2Q10 net income was $192 mn vs. $785 mn of net loss in 1Q10.

· Solid results in Russia. Steel division’s EBITDA climbed by 31% q-o-q to $528 mn. EBITDA margin climbed 2 ppt to 22%. Severstal Recourse’s EBITDA jumped by 2.3 times q-o-q to $420 mn, and EBITDA margin added 18 ppt to 48%.

· Gold mining segment: growth continues, on track to transparency increase. EBITDA surged 33% q-o-q to $89 mn and EBITDA margin rose 4 ppt to 54%.

· Severstal North America: 2Q10 positive EBITDA. Severstal’s North American EBITDA (SNA) amounted to $59 mn vs. $83 of EBITDA loss in 1Q10. SNA’s revenue increased by 24% q-o-q to $1,447 mn.

· Comfortable debt load. We forecast Net debt-to-EBITDA ratio at 1.5 for the year-end that implies a comfort debt load.
 

Attachments

  • SVST_1H10_review_06_09_10_eng.pdf
    80.6 KB · Views: 603
  • Equity_Daily_tkbc_07_09_10_eng.pdf
    324.9 KB · Views: 551
Veropharm's 2Q10 and 1H10 IFRS results: margins well above the expectations.

A note on Veropharm (VRPH RU) - see attached.

* Margins at all-time highs. Yesterday, Veropharm reported its unaudited 1H10 IFRS results, which beat our forecasts and market consensus on the margin side. The company’s 2Q10 revenue increased by 23% y-o-y in ruble terms (vs. only 5% y-o-y growth in 1Q10, when the company acknowledged the underproduction of several categories of drugs due to the lack of ingredients as a result of suppliers’ problems). Thus, 1H10 sales growth totaled 16% y-o-y that outpaces the overall market growth of 4%). Veropharm’s 2Q10 gross margin soared to 73.6% (vs. our forecast of 70%) on considerable margins expansion in all segments and ongoing increase in share of high-margin prescription drugs sales (amounted 75% of total sales in 2Q10 at the expense of decreased share of lower-margin traditional drugs and adhesive bandages sales). Hence, Veropharm gross margin peaked to 73.3% in 1H10 hitting all-time high. 2Q10 SG&A expenses returned back to the normal level and totaled 33.5% of sales after they shot up to 55% in 1Q10. EBITDA margin jumped to 42% in 2Q10 that boosted 1H10 EBITDA margin to 34.3% (vs. 33% in 1H09). Veropharm’s net margin increased to 27.3% in 1H10 that implies 34% y-o-y growth in the company’s EPS (in dollar terms).

* BUY recommendation reiterated. After such an impressive recovery of the company’s financials from disappointing 1Q10 results we see that Veropharm is on track to meet our top-line growth forecast and management guidance on margins that looks even more optimistic than ours. As a reminder, the company earlier claimed that it intends to outperform market by growth rates this year (expected at 20% y-o-y in retail segment in ruble terms), which are likely to meet our forecast of 24% y-o-y top line growth (in ruble terms). Furthermore, this year Veropharm plans to achieve gross margin of 70% (vs. our current forecast of 68%) and EBITDA margin of up to 40% (vs. our forecast of 32%). Thus, we see some upside risks to our Veropharm valuation model and plan to revise it after receiving more details from the company on margins performance. We reaffirm our BUY recommendation for the stock with the end-2010 target price of $47/share, which implies more than 25% of upside potential. Relative valuation of Veropharm in comparison with its EM peers implies almost a 40% discount based on 2010E EV/EBITDA.
 

Attachments

  • VRPH_10_09_10_eng.pdf
    87.6 KB · Views: 683
Flows on a daily basis.

Hi all. I am thinking of starting to publish here my flows in Russian equities and their DRs. Pls let me know if that might be of interest. If you are keen on this, pls contact me on how you can get set-up to trade Russian equities opening a "multi-currency single account" at our Cyprus subsidiary.

Russian local market opens an hour earlier than DRs on London International. This is why at 07:35 am I will be sending out my morning and pre-market flow. PLS NOTE that for ALL blue chips of Gazprom, LUKoil and RosNeft variety I will show you a 2-way market IN LONDON-TRADED DRs BEFORE London International opens.


Friday's pre-market looked like this:

WE BUY
450k Gazprom (GAZP RU) inline
5mn Sberbank (SBER RU) working 30min
25k Lukoil (LKOH RU) inline
15mn Hydro (HYDR RU) inline

WE SELL
200k Rosneft (ROSN RU) inline
20k Nor.Nik (GMKN RU) mkt lvl
1.5mn Surgut (SNGS RU) mkt lvl
60mn Fed. Grid (FEES RU) inline


Right after London International opens I will be sending you my flows in Mid&Small Caps. On Friday it looked like this:

WE BUY
10k Ammofos (AMMO RU) mkt lvl
150k Chel. Pipe (CHEP RU) mkt lvl
120mn MRSK Ural (MRKU RU) itw
600k Suek-Kuzbass (SKZB RU) itw
1mn Nizhnekamsk Pf (NKNCP RU) itw
200mn Inter RAO (IRAO RU) mkt lvl
1.5mn South Tel. (KUBN RU) mkt lvl
1k Kovr. Mekh. (KVMZ RU) inline

WE SELL
1.5mn KuzbasRazrez (KZRU RU) itw
100k TMK (TRMK RU) itw
100mn MRSK Volga (MRKV RU) itw
40mn RAO East (VRAO RU) itw
100k Rostel Pf (RTKMP RU) inline
200K Tatneft Pf (TATNP RU) inline
20mn Uralsvyaz (URSI RU) mkt lvl
200k Dalsvyaz (ESPK RU) mkt lvl
2k Vyborg Ship. (VSSZP RU) itw
20k Baltika Pf (PKBAP RU) itw
20k 36'6 (APTK RU) itw
50k Pik Group (PIKK RU) itw


Pls let me know if this is of any interest.

CW.
 
Morning flow - 14.09.2010

WE BUY
400k Gazprom (GAZP RU) inline
1.5m Sberbank (SBER RU) inline
50k Lukoil (LKOH RU) inline
5mn Surgut (SNGS RU) vwap
1.5k Transneft (TRNFPRU) mkt lvl


WE SELL
650k Rosneft (ROSN RU) 1/3 vol.
3bn VTB (VTBR RU) itw
120k Novatek (NVTK RU) mkt lvl
20mn Hydro (HYDR RU) inline
250m Inter RAO(IRAO RU) inline
 
Latest research notes - Magnitogorsk Steel, Nuclear Fuel producers, Raspadskaya

Latest research notes for your attention (also on Bloomberg under {NSN L8SLV83PWT1C <GO>}). Raspadskaya remains our STRONG PICK.


Magnitogorsk Steel – MMK:

• In anticipation of neutral results. Tomorrow MMK is slated to announce its 2Q10 IFRS financial statement. We expect the company to show neutral results. In particular, in 2Q10 we forecast the company’s revenue to surge 22% q-o-q to $2,021 mn, EBITDA to increase by 19% q-o-q to $433 mn and net income to rise 33% q-o-q to $125 mn. According to our estimates, EBITDA margin should be slightly lower than in 1Q10 due to the growth of raw materials prices, mainly of iron ore. We estimate MMK’s 2Q10 EBITDA margin at 21% that is still quite a good number.

• We maintain HOLD recommendation on the stock. We regard MMK’s stock as an attractive bet on steel prices growth. We suppose that during a follow-up conference-call MMK’s officials will provide guidance concerning steel demand and steel prices till the end of 2010. We reaffirm our HOLD recommendation for the stock with the target price of $1.06/share.


Nuclear Fuel Producers – MASZ, NZHK:

The consolidation by TVEL of its main nuclear enrichment companies set new priorities. Atomenergoprom’s subsidiary plans to rebuild nuclear fuel cycle in Russia according to the world practice. In this case, both nuclear fuel fabricators – Mashinostroitelny Zavod (MSZ) and Novosibirsk Chemical Concentrates Plant (NCCP) – may suffer from such developments in the industry. We believe this was already reflected in NCCP's 1H10 financials. We reaffirm our HOLD rating for MSZ and downgrade NCCP from HOLD to SELL with the new target prices of $300/share and $8/share, respectively.


Raspadskaya – RASP:

• EBITDA to grow by 40% in 1H10. Raspadskaya should disclose its 1H10 financials on 17 September. We expect moderately positive results. The accident on its key mine has prevented Raspadskaya to fully capitalize on a considerable increase in coking coal prices and to show stronger numbers. We forecast 1H10 revenue to increase by 24% h-o-h to $434 mn, EBITDA to jump 40% h-o-h to $269 mn, net income to edge up 31% h-o-h to $167 mn. We estimate Raspadskaya’s EBITDA margin to approach the best figures (61% and 72% in 2007-2008, respectively). According to our estimates, 1H10 EBITDA margin should add 7 ppt h-o-h to 62%.

• We maintain our positive view on Raspadskaya. We believe that Raspadskaya remains the most attractive play in the Russian coal universe and its stock has a considerable upside potential. The key mine’s gradual recovery, as well as strong coking coal market environment should boost the company’s market capitalization. We recommend to BUY Raspadskaya with the target price of $8.5 per share.


Fire away any questions or comments.
 

Attachments

  • RASP_1H10_preview_tkbc_15_09_10_eng.pdf
    79 KB · Views: 493
  • MASZ_NZHK_15_09_10_eng.pdf
    284.5 KB · Views: 748
  • MMK_2Q10_preview_tkbc_15_09_10_eng.pdf
    75.1 KB · Views: 477
Morning Flows - 20.09.2010

WE BUY
55k Norilsk (GMKN RU) 1/3 vol
400k Gazprom (GAZP RU) inline
250k Rosneft (ROSN RU) inline
150k Uralkali (URKA RU) mkt lvl
2bn VTB (VTBR RU) inline
25mn Hydro (HYDR RU) inline
250mn Inter RAO (IRAO RU) inline

WE SELL
75k Lukoil (LKOH RU) inline
2mn Surgut (SNGS RU) inline
1.5n Surgutprf (SNGSpRU) mkt lvl
2mn Sberbank (SBER RU) inline
200k Novatek (NVTK RU) inline
1.5k Transneft (TRNFpRU) inline
250k Dalsvyaz (ESPK RU) inline
 
Mid & Small Caps Flows - 20.09.2010

WE BUY
15mn OGK-1 (OGKA RU) inline
8mn OGK-4 (OGKD RU) inline
10mn OGK-6 (OGKF RU) mkt lvl
5mn Mosenergo (MSNG RU) working
10mn MRSK Centr (MRKC RU) inline
120k Volgatel (NNSI RU) inline
1.5m Center Tel (ESMO RU) inline
25mn Sibir Tel. (ENCO RU) otd
100k Raspadskya (RASP RU) inline
75k Aeroflot (AFLT RU) mkt lvl
5k Ammofos (AMMO RU) inline


WE SELL
5mn OGK-2 (OGKB RU) inline
23mn OGK-5 (OGKE RU) vwap
500m Inter RAO (IRAO RU) working
200m Fderal Grid (FEES RU) inline
15mn MRSK Ural (MRKU RU) itw
30mn Uralsvyaz (URSI RU) inline
400k Dalsvayz (ESPK RU) itw
40k B.St.Pet.prf(BSPBpRU) inline
500k Belon (BLNG RU) itw
2mn Kuzbasrazrez(KZRU RU) mkt lvl
30k Akron (AKRN RU) itw
 
Hi

Do you have access to research from Moscow-based investment bank Troika Dialog?


Apparently, they believe, in a report published in October 2010 (unfortunately don't have URL), that Russia’s publicly-traded gold companies may more than double their production in the next five years, and the country’s uranium output may increase even more over that same time period.

That’s the outlook offered by the Moscow-based investment bank Troika Dialog,
The way Troika sees it, Russia has four key growth drivers at work for investors, including:
– low penetration in the domestic sectors,
- mining growth,
- fiscal reforms and
- market consolidation that allows companies to get bigger and benefit from scale.

By sector, publicly-traded retail companies are seen as most poised for strong growth through 2015 – Troika predicts 25% annual growth for the five years.

Rationale: organized retail only accounts for 40% of sales, compared to more than 90% for Europe as a whole. (This is good news for Aurora Russia's investment in its diy-chain)

The same low-penetration story is seen in broadband (6% nationwide), banking (few people have credit cards or bank loans), automotive (44 cars per 100 households, well less than half of Germany’s rate), pharmaceuticals (per-capita spending only 25% of Europe’s rate) and more.

Rising commodity prices, which in the past decade had been Russia’s biggest growth driver, are not seen as much of a factor in the next five years. Instead, mining sector growth is expected to be more a story of production growth.

Your view?
 
Happy 2011 and 2nd decade of the Millennium to you!

Good morning and good start to the New Year – and the new decade! The market is rising on spillover from the best December in nearly 20 years; let us not forget we are still – even after the latest rally – rising from a rather low base. Exactly 10 years ago, when we had just seen in the new Millennium, S&P closed at – guess where? 1455.22! It was a stormy 10 years by all means, it was the first decade since WWII when just pure index-tracking – in developed economies - would fetch you a net loss, even in nominal numbers, say nothing about real dollars.

Different story in all major EMs, where the past decade was a major break-through. Still, as the past couple of years showed, the same mantra applies to all, developed and emerging alike – this is not a time for MACRO index-tracking, this is a time for careful MICRO-story picking.. My personal top picks among Russia’s micro-stories are Norilsk DRs (MNOD), Vsmpo-Avisma (VSMO) and Chelyabinsk Pipes (CHEP).

Happy 2011 and 2nd decade of the Millennium to you! :clap:
 
Strategy 2011.

Pls find our Strategy note for 2011 attached. Good trading in 2011 to you! (y)
 

Attachments

  • STRATEGY_2011_tkbc_eng.pdf
    1.6 MB · Views: 1,722
Why I am bullish on 2011?

Let us dissect yesterday's news reel asunder for a second:

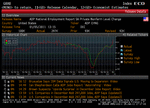
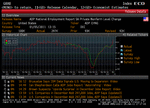
1) Jobs. We mentioned a gazillion times last year (see e.g. Bloomberg link {NSN L7LFFK3PWT1C <GO>} from 23 August 2010) that we were in the worst jobs situation since Ronald and Maggie, meaning essentially that we were still scraping off the bottoms of the recession. We also emphasized that only a VISIBLY improving jobs situation can justify Mr. Market Hopeful's latest rally. Well - we just received a VERY VISIBLE endorsement that it is improving. U.S. companies boosted payrolls last month by the most since at least Dec 2000 back till which historical data was made available for ADP National Employment Report - see chart attached. Unless my vision is somehow deluded, we just printed the highest reading for that index in the past 10 years!

2) ARM and CSR. As an ex-trader who traded ARM all way down after the demise of NASDAQ, I am of course overjoyed to see it print the highest price since Feb 2001. Jokes aside, both chip-makers supplying iPhone and Nokia's Oyj respectively propelled next to 8% up yesterday. In ARM's case it means investors have appetite for a stock trading at 150 P/E!!! Atheros deal is cool, but the real McCoy is that investing in "gadget"-makers (running on ARM's and CSR's chips) is seen to be a sure play as both corporates and individuals, domestically and worldwide alike, are seen HAVING money and WILLING to spend it on "gadgets" well above the essential level of a bread basket.

3) Atheros deal. Qualcomm, the world's largest maker of mobile-phone chips, agreed to buy Atheros for about $3.2 billion in cash, broadening its lineup of Wi-Fi networking technology. Just another M&A deal going to show that corporates' coffers are galore with monies - willingly spent on M&A.


Schroder's Richard Buxton's benchmark target of 7,000 for 2011 may bloody well be an undershoot :)

Point I want to make here is that we are not talking of NASDAQ flying to 5K from 4K in 1999 - even 4K was a debauchery. We are taking off from a very low base, as - in many ways - we are just trying to get our head above the bottom of the worst recession since Hoover and Al Capone. Afraid of bubble ready to burst? Be more afraid of the air inside of the bubble just starting to get heated! :)

Good trading to you!
 

Attachments

  • ADP_Highest_Reading_in_10_Years.gif
    ADP_Highest_Reading_in_10_Years.gif
    49.8 KB · Views: 199
Jobs situation - ripe to turn around from deep bottom? Morning comment - 14.01.20

Good morning! And Happy Orthodox New Year to all those who, alongside Russian and Serbian Orthodox Churches, celebrate the New Year today by old-style Julian calendar! :)

Markets were bombastic recently, with FTSE and DAX seeming to have resolved “psychological” figures of 6K and 7K to the upside, CAC ready to storm 4K, and MICEX posting its biggest gain since July 6! Jingle bells all round :) But let us take a look where we are really.

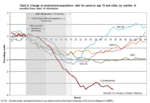
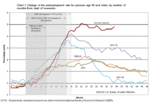
In the attached charts I am enclosing – courtesy of St Louis Fed and Bureau of Labor Statistics:

  1. Change in the Unemployment Rate in the current and previous major recessions;
  2. Civilian Employment-Population Ratio since late 1940-ies;
  3. Change in Employment-Population Ratio in the current and previous major recessions;
  4. Ratio of nonfarm payrolls to the nonfarm payrolls at the start of recession – also for current and previous recessions.

Wherever you look – complete and utter SHAMBLES in jobs situation. Double dip? You cannot dip again to where you have not got out from – the bottom of the worst and most prolonged recession since WWII. Most disturbing thing is that NONE of the above indicators have improved since Summer 2010 – despite all the efforts by central bankers and abundance of money ready to be spent in the market. More to that, recent drop in unemployment (to 9.4%) had very little to do with newly created jobs. Instead, it was primarily due to 260,000 workers dropping out of the labour force. As a result, the labour force has shrunk by 246,000 from the pre-crisis 2007 level (The U.S. labor force average growth rate is supposed to be around 0.8% per year from 2000 to 2050, courtesy of Joel Kotkin, a scholar on urban development). Furthermore, not only the number of discouraged workers over job prospects hit a record high (since 1994, the earliest year the data is available) of just over 1.3 million --more than the number of jobs added in 2010--but the labor participation rate also plunged to a 25-year low of 64.3%!!

To add more pain, the average number of weeks people remain unemployed also has risen to 34.2 weeks in December 2010 vs. 33.9 weeks in November, with 6.4 million jobless people classified as long-term unemployed, i.e. without a job for 27+ weeks. All these suggest there is a large number of frustrated workers who left the labour pool but unaccounted for in the unemployment rate calculation. That means the all inclusive jobless rate could easily be 11% or more, instead of the 9.4%!


Not just gloom and doom. LASTING gloom and doom, lasting more than any other previous recession.

However we may be at a unique juncture in current economy situation. When you toss a yo-yo towards the floor, its position – however low it might be – is not that relevant, what is important is its MOMENTUM, that is whether the yo-yo keeps on falling down, stalls or reverses back up. And recent ASTONISHING ADP National Employment Report (see our previous comment on Bloomberg under {NSN LELC2A3PWT1D <GO>}, see also chart attached) – which clearly reversed from negative to positive readings, posting the highest POSITIVE number since at least December 2000!) - is a compelling reason to believe the yo-yo is ready to bounce back from its low.


Are you thinking what I am thinking? :) If this is indeed the case, we are in for a VISIBLE TURN-AROUND in jobs situation in 2011, and that will drive equity markets crazy. Junctures of such reversal variety happen once in a blue moon – and the FEAR to miss this unique train, with cash galore in the market acting as petrol spilt on fire, will send the equities shuttle to the Moon!

Good trading to you!
 

Attachments

  • ADP_Highest_Reading_in_10_Years.gif
    ADP_Highest_Reading_in_10_Years.gif
    49.8 KB · Views: 206
  • Chart4_Nonfarm_Payroll_Ratio.GIF
    Chart4_Nonfarm_Payroll_Ratio.GIF
    11.1 KB · Views: 198
  • Chart3_Empl_Population_Ratio.GIF
    Chart3_Empl_Population_Ratio.GIF
    35.5 KB · Views: 210
  • Chart2_Civilian_Emp_Population_Ratio.GIF
    Chart2_Civilian_Emp_Population_Ratio.GIF
    19.8 KB · Views: 183
  • Chart1_Unempl_Rate.GIF
    Chart1_Unempl_Rate.GIF
    35.9 KB · Views: 217
Rosneft, TNK-BP and CHEP - quick comment.

Good morning! It is hardly a secret that about 20% of strategic assets of BP Plc is stashed with TNK-BP, and now we have another MEGA manifestation of global importance of Russia to BP. BP’s drive to extract billions of barrels of petroleum from above the Arctic Circle (which may hold as much as 100 billion barrels of oil and gas) is a clear counter to Petrobras & Friends who will definitely go far beyond Carioca in their shelf exploration. To fend that off BP is willing to go far, as far as going to bed with a state-owned producer. BP is willing to do that despite potentially hurting its reputation in the US – it is quite clear that this acquisition will almost certainly complicate the politics of levying and collecting damages from BP.

Given the US aspect of the deal, I will stay away from putting a positive tag on BP share price. HOWEVER, for RosNeft and TNK-BP this deal puts a hard wooden floor for future price action. Buying their shares is a virtually risk-free deal.

On a separate note, our trading idea in CHEP from 29 December 2010 (see below) is playing down to the T. $ 3.50 (roughly RUR 105) is a natural target there going into the IPO.


--------------------------------------------------------------------------------

Sent: Wednesday, December 29, 2010 5:52 PM
Subject: Idea 3 to kick-off 2011 in style - BUY Chelyabinsk Pipe Works CHEP into IPO of CTPZ
Importance: High

Idea 3 to kick-off 2011 in style – BUY Chelyabinsk Pipe Works CHEP into IPO of CTPZ:

I mentioned on 3 December (see below and notes attached) that fundamentally our target price for CHEP is $ 3.0 or roughly 93 RUR – but given the political importance of the forthcoming IPO of CTPZ which will put the production of both conventional and large diameter pipes under one roof – investors will HAVE to have the new stock in their portfolios and that will drive the share price to the sky going into the IPO. CHEP’s share price on 3 December was 60 RUR, it is 82 RUR today.

I re-iterate my STRONG BUY view on CHEP anywhere below 90 RUR, seeing 100-120 RUR price range going into the IPO in 2011.
 

Attachments

  • CHEP_tkbc_02_12_2010_eng.pdf
    135.7 KB · Views: 550
  • CHEP_tkbc_14_10_10_eng.pdf
    151.8 KB · Views: 1,044
AFIMALL City receives certificate of completion. POSITIVE

AFIMALL City receives certificate of completion. POSITIVE

AFI Development (AFID LI – Buy, our top pick, see Strategy 2011 attached) today announces that it has now received a certificate of completion from the City of Moscow authorities for the operation of the AFIMALL City (also known as Mall of Russia) shopping centre. The Mall will be open shortly. Earlier company expected to open the store in early December 2010. AFIMALL City is one of the largest retail developments to open in Europe recent years, with a total area of nearly 180,000 sq. m. Approximately 75% of the retail shops in the Mall have been let at an average effective rate of $1,200 per sq m per year and tenants are currently progressing with fit outs. Tenants at AFIMALL City include Marks & Spencer, Gap, H&M, Zara, Next, as well as X5, Russia's largest retail company and Eldorado, the country's leading consumer electronics retailing group. Assuming 20% vacancy rates for the project, we forecast its operating and net operating income to be at $78 mn and $55 mn respectively in 2011. We estimate the Mall net value to be at $720 mn by the end of 2011, which accounts for 36% of the total value of the company’s projects. We regard this news as POSITIVE for AFI Development stock.

Our 12-month’s target price of AFI Development is $1.8 per share.
 

Attachments

  • STRATEGY_2011_tkbc_eng.pdf
    1.6 MB · Views: 519
Export duties for crude oil and oil products will change . Side effect for MostoTrest

Pls find attached a very concise summary of our views on Oil&Gas stocks for your attention. 2 things I personally find uber important:

1) It is yet another argument in favour of TNK-BP which is my personal top pick in Oil&Gas. The only thing keeping it to the ground is its liquidity/free float constraint.

2) Much of that “freed-up” money, as I mentioned before is actually freed up for the “road fund” in a desperate move to pull Russia out of its shambolic infrastructure situation – especially in view of World Cup 2018. All of a sudden, a research note on Oil&Gas start sounding like a BUY on MostoTrest (MSTT) and LSR Group (LSRG)…….
 

Attachments

  • Export duties_tkbc_21_01_10_eng.pdf
    91.7 KB · Views: 544
BP, TNK-BP and divs intrigue. BUY on TNK-BP either way.

Dividends may be a tricky issue – and a powerful tool for blackmail:

It is thought that BP will announce the reinstatement of its dividend in its fourth quarter results, due this week. It will reinstate it at around seven cents half the level of the 2009 dividend. Total amount of BP divs scrapped after the oil spill is £5.4 billion.

Now, Russian shareholders of TNK-BP (the parent of TNK-BP Holding) are threatening to block the decision on dividends. This way they are hoping to wriggle more leverage on BP, which feeds on dividends from TNK-BP (particularly now, when BP is in financial distress and needs cash).

How big might the impact be? In 2010, TNK-BP Holding could pay roughly $6 bn in dividends (top estimate). The holding already paid $4.3 bn in dividends for 9M10. The fourth quarter was strong (high oil price plus tax breaks in East Siberia). So, if TNBP were to declare zero dividends for 4Q10, BP could lose up to roughly $800 mn (for the quarter alone!).

There is no dividend policy for TNK-BP Holding – thus, a scenario of zero dividends is possible in theory. The decision is to be made by the board (4 representatives of ARR, 4 representatives of BP and 3 independent directors). So, ultimately, the independent directors are to decide on that. If TNK-BP Holding be to declare zero dividends, the Group (TNK-BP Ltd) will have to come up with another source for dividends . At the Group level (TNK-BP Ltd), the shareholders can block payout only above 40%.

Two key dates to watch are tomorrow (High Court of London to review TNK-BP claim against BP), February 17-18 – TNK-BP Ltd’s board is scheduled to meet to recommend dividends. In short, if you believe the conflict is to be resolved quickly, you should be rushing into TNK-BP share. If you think the conflict may pan out into a lengthy one, you do not need to rush  - but you still want to own the stock. BUY anyway – there is no way TNK-BP might eventually lose out in a set-up where it is a) a major source of divs for BP; and 2) a major stash-away of BP’s strategic assets.
 
TNK-BP. Deeper in bed with Russians.

I mentioned before there is NO way TNK-BP with its 1) dividends that BP desperately needs; and 2) amount of BP's strategic assets stashed under TNK-BP's roof - might NOT benefit from BP getting deeper in bed with Russians going forward, whoever (RosNeft or otherwise) gets chosen as that particular partner-in-bed :).

I re-iterate my view on TNK-BP as STRONG BUY in Russian oils currently. My Oil&Gas analyst Eugenia Dyshlyuk is superb in establishing the paper as HOLD fundamentally (see Page 2 in note attached)– however it is BP’s fat bacon, and the sort of bacon that is very much liked by Russian Oils. With a peanut free float, when it flies, sky is the limit :)

* Speculations that AAR may sell its stake in TNK-BP heat up again. Vedomosti reported today, citing own information sources, that the Russian shareholders of TNK-BP Group (which includes TNK-BP Holding) – AAR (Alfa Group, Access Industries and
Renova) – may sell their stakes in the group to Rosneft or to the state. One of the options envisages a share swap. While there is no market valuation for TNK-BP Group, we estimate that a 50% stake in TNK-BP Holding (the main asset of the group) may be
exchanged for a 24% stake in Rosneft at the current market prices (market cap of Rosneft at $89 bn. and of TNK-BP Holding at $43 bn). According to Vedomosti sources, AAR expects to receive a premium to the market value of the company (top estimate of
the fair value of TNK-BP Group voiced by AAR was $60 bn), while Rosneft believes there should be a discount. We do not rule out a possibility of changes in TNK-BP Group shareholding structure. Perhaps, this is the reason why TNK-BP Holding obtained listing
at Russia’s main stock exchanges in the end of 2010 that boosted the stock’s liquidity and valuation. In our view, changes in the shareholding structure of TNK-BP Group that may lead to a buy-out offer to the minority shareholders are positive for the stock and
the newsflow should support performance of TNK-BP Holding shares.
 

Attachments

  • Equity_Daily_tkbc_04_02_11_eng.pdf
    373.8 KB · Views: 946
TransContainer and MRSK. Initiation of Coverage.

1. We initiate coverage of TransContainer:

We recommend to BUY the stocks and GDRs with 12M target price at $120 and $12.0 respectively, which means 24% and 22% upside potential from the current market level. The company placed its shares on the market in November 2010, and the stocks performed well since that time posting 21% (22.5% for GDRs) growth. We expect investor’s interest to the transportation stocks will remain high in the coming years. Currently company’s GDRs are traded with EV/EBITDA 2011E 7.1 and P/E 2011E 16.5 that is 32% discount and 1% premium to its EM peers. Solid growth profile, strong market drivers and support from the state determine favorable prospects of the company and will increase demand for the shares in the future. The main risks related to this investment idea come from a side of market growth and possible changes in tariff regulation. Corporate events in the transportation segment will boost investors’ interest to the traded stocks


2. We initiate coverage of Russian companies in the distribution network sector with a positive outlook on its prospects:

We expect a significant improvement in the fundamental attractiveness of the sector as a result of a large-scale transition to RAB-regulation. Our recommendation for large companies included in MRSK Holding – BUY. Preferred shares of the MRSK Holding itself appear to us to be a general, diversified instrument for investing in the distribution network sector, and we recommend BUYing them as a way to even out the risk of the separate regional companies.

Valuation. We valued all MRSK Holding companies using DCF based on approved RAB regulation and long-term tariff indexation parameters taken from MRSK Holding statements. We valued MRSK Holding shares using DCF models for the separate MRSK, as well as using the total asset valuation method.

Our favourites – MRSK of Center (MRKC), MOESK (MSRS) and MRSK of South (MRKY) shares which, in our opinion, provide both fundamental attractiveness and liquidity.
 

Attachments

  • TransContainer_tkbc_03_03_11_eng.pdf
    1.3 MB · Views: 920
  • MRSK_Initiation of Coverage_03_03_2011_eng.pdf
    995.9 KB · Views: 317
Anyone around that trades Russian stocks? I trade full time, mainly on IOB, would be good to perhaps share some ideas etc.
 
Top