Time & sales on Futures

blash

Active member
Messages
111
Likes
0
Anybody help with the following please.

I know people use T&S quite alot when trading stocks but what about when trading futures?


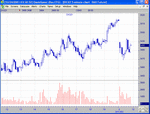
In the attached image there is a trade of 251 contracts in the Dax at 17:29:08

Is this one individual party trading 251 contracts or an amalgamation of partys all trading at the same price?

The trade was 4 points below the previous Bid, can this be read as someone buying below the bid? The market certainly moved up from there and the bids certainly increased to 157.

The trade of 14 contracts at 17:29:13 was at the previous bid so was this someone selling?
 

Attachments

  • t&s.gif
    t&s.gif
    18.8 KB · Views: 1,089
looks like somebody sold 250 lots at market which hit all the bids down to 70
 
I looked at this in r/t and decided it was a sale.. Volume spike and price fell = sale..
 
It just shows how we can easily have opposite views.

This is how I read the situation.

Yeh I agree the price fell but only so that the pro who I think was a buyer could get his fill.

To trade with these kind of volumes the big buyers can only get filled when every one else is selling.

The price at which this happened was a typical place to put a sell stop from the earlier bounce 15:30.

Looking at the chart the price rose immediatley after this trade. It would appear somone new something. I know the institutions etc have deep pockets but surely they wouldnt have sold there would they?
 

Attachments

  • dx251.gif
    dx251.gif
    24.8 KB · Views: 734
Big sellers - who are smart - unload partially in uptrends so they are not stuck with 100s of contracts at a top and no way out..

They cannot buy 100 contracts at bottom at once and sell 100 at top.. They must scale in or out..

If you look in avery DAX uptrend there are volume spikes which signify short term his when a big seller clears some contracts.

ALll imo of course,.. but I use volume spikes as a sell signal when scalping.. BEFORE the price falls.
 
blash said:
It just shows how we can easily have opposite views.

This is how I read the situation.

Yeh I agree the price fell but only so that the pro who I think was a buyer could get his fill.


So the market moved down to accomodate the buyer ?

Can you explain pleeze ?
 
A friend who uses index futures to hedge options positions in the hundreds of contracts size says that genrally if the mkt is moving and you want to get it done, you look at the depth of market and look for your average price that you are going to get and accept that.
Eg. Dax is 75 bid in 10 lots, but down to 70 you can sell 250 lots avg 72, if mkt is moving down, better to do that than work a 75 limit. Hence spike to 70.

Also, for whatever reason, people tend to buy up to or sell down to levels - always a pattern, not worth trying to work out why, just look for it to happen.
 
Last edited:
waqr - Maybe that was badly worded.

I doubt the market was moved down to accomodate any specific buyer in the futures market.

The price at which this took place was just below a previous support level which is maybe where a lot of people will have sell stops thinking that if this is broken then the market is going lower. A trader of size who maybe knows there is going to be an up move will know that this will be a good area to get a large long fill.

I maybe reading far too much into this but this is how I interprut what happened.
 
Last edited:
Thats OK.

I just wanted to make sure I was understanding what you were saying.

Does this mean then that you guys are watching the T&S screen?
 
I nevre watch the T&S screnn but becuase I have a volume scan sunning if I get a volume warning I can look at T&S if I want to. But usually the posittion of the candle relative to bollingers/keltners says it all..

If we have a flat top after a rise and in /near top of keltner channels, 95% odds of a sell.. usually confirmed next bar by a fall..
 
If we have a flat top after a rise and in /near top of keltner channels, 95% odds of a sell.. usually confirmed next bar by a fall..

madasafish,
appreciate your input.

Any chance you could post up a chart of the above in action for us lesser mortals?
 
Picture?

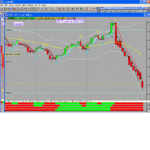
Well here is one of the 1 minute chart of DAX 17th October 2003.. (you may want to open it in Paint and expand it to see it more clearly. Note the flat top outside the white Bollinger Bands (practically interchangeable with Keltner - I use both) and at the bottom of the chart the small white triangles.. the latter are the scns showing volume spikes.. (they blow whistles in real time so I can see what's happening and hear it as well..)
after that the price collapsed...
 

Attachments

  • dax17oct2003.gif
    dax17oct2003.gif
    259.1 KB · Views: 542
I hardly ever watch time and sales or market depth, find it is a red herring.

I used to have two screens, one with trade screen on and the other with charts - found that encouraged me to fiddle around with a postion once it was on, whereas now I have gone to having charts on top and watch that most of the time.
Much less distractng when you're short and someone is bidding for 200 lots and pushing it against you ;-)
 
I started another thread on the inaccuracies of charts but I'll just post hear aswell.

It amazes me how the different charting packages or data feeds provide different data.

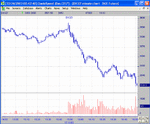
I've had a look at my chart on 1min for Dec Dax future and dont get a flat top using the Tenfore feed and Quotespeed charting.
 

Attachments

  • dx17oct.gif
    dx17oct.gif
    21.5 KB · Views: 378
It looks like madasafish has an extra 1min bar in the chart (the bar before the downward yellow arrow)

I could understand it if there was an extra tick or two but a whole bar seems very wierd.

This was discussed in the other thread that there are 2 feeds from the Eurex exchange which can cause a difference on the chart but still doesnt explain a whole candle missing.

???
 
Last edited:
My Dax chart starts at 8:03 and I use Mytrack...does yours start at 8:00?
Since Mytrack datestamps each bar it could be them...
 
Mine starts at 09:00 (german time) with an open of 3489.50 and the 09:03 bar has an open of 3481.50

If yours starts 3 minutes later and is a few secounds out of sync with Tenfore then I can see how there could be difference in the charts.

If Mytrack was showing a possible short becaus of the flat top would you still have shorted using the Tenfore charts?
 
Top