Things Will Get Better But First ......

wisestguy

Well-known member
Messages
471
Likes
0
is it just me or are the topics on board getting back to that old repetitous and boring phase ?

OK , I'm going to wade in now and start another round of stimulating conversation but first a favour for a favour yeah ?

I need accounting type people and people knowledgable on currency swaps.

1) currency swaps .

when I worked in a bank treasury , most so called colleugues hated to share information with each other despite the bank's new age fag " let's all get along " policy.
there was tremendous bitchiness amongst co-workers. anytime I asked about info , the stock reply was to give in such convulted terms that it took you a month just to decipher it .
such is bank culture.

so I was not a dumbsh1t as my colleugues had hoped for ,I managed to elicit info for most things I wanted one way or another .

one thing that eluded me slightly were currency swaps . now as I see it CS are forex forward contrat swapped to earn the interest ( or price gain on the swap ) on the the opposing currency , for a duration before the maturity of the forward .

so you get a double bonus on the trade:

- you make on favourable moves on your forward contract

- you also make on the price moves on your swap contract , which is also a bonus if the forward position is not an outright trade , ie) a hedge of somesort.

is this right ?


2) why do balance sheets have to balance ?

yes I know all the rest of the info can be garnered from other statements - P & L , cash flow , depreciation , contigencies etc .

but what is the use of a balance sheet that is always even , why not just have a assets page since you will know automatically that the liabilities will be the same ?
 
the answer to 2 is because companies are usually regarded as a seperate legal entity to that of the owners.

and secondly assets does not always equal liabilities. this is a fallacy that you are purporting.

when a balance sheet has to balance it refers to the Assets+Liabilities total balancing to the shareholders funds (share capital, share premium and retained earnings)

the ratio of assets to liabilities is one, if a little rudimentary and not to be taken in isolation, method of comparing companies in terms of liquidity etc.

cant vouch for part 1) as i have no idea.

fc
 
are not shareholders funds part of assets ?

and can you explain more on this part ' the ratio of assets to liabilities is one, if a little rudimentary and not to be taken in isolation, method of comparing companies in terms of liquidity etc. '

what does it men in relation to my Q.
 
wisestguy said:
are not shareholders funds part of assets ?

No. Shareholders funds are a liability. They are the net worth of the business that is owed to the shareholders. When a business is wound up the shareholders get paid their shareholders funds (if the're lucky) in the same way that trade creditors get paid.

Basically a company owns assets and all these assets are owed to somebody, either “external” such as trade creditors, Inland Revenue, the banks etc or “internal” ie the owners of the business.

Gerard
 
no no.

still haven't answered the Q . balance sheet = assets equal value to liabilities . why ?
 
wisestguy said:
no no.

still haven't answered the Q . balance sheet = assets equal value to liabilities . why ?

If you add all the assets and subtract all the liabilities you get the net worth of the business. This in turn is owed to the owners of the business (ie it is also a liability). The net worth of the business is the balancing factor that makes all assets equal all liabilities.

So:

Buildings (Fixed Assets) + Bank money (Current Assets 1) + Debtors, Stock (Current Assets 2) – Trade Creditors (Current Liabilities 1) –Inland Revenue, Customs & Excise (Current Liabilities 2) – Bank loans (Liabilities)

=

Amout due to the owners (Liability to the shareholders).

Simple maths means that:

Fixed Assets + Current Assets 1 + Current Assets 2 = Current Liabilities 1 + Current Liabilities 2 + Liability to shareholders

ie: Assets = Liabilities and the balance sheet squares.

Gerard
 
Ok , no you're talking . that all makes perfect sense.

so under what item item are liabilities to s/holders listed as in the liabilities sheet , if that is where they are indeed listed.
 
wisestguy said:
Ok , no you're talking . that all makes perfect sense.

so under what item item are liabilities to s/holders listed as in the liabilities sheet , if that is where they are indeed listed.

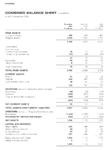
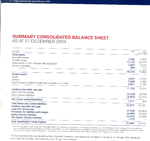
Here’s two examples of recent Balance Sheets. Both of these are basically in the format of my first equation. Shareholders funds are shown at the end. In the case of Brambles they are labelled “Capital & Reserves” and they distinguish how the shareholders funds have been generated.

Theoretically a balance sheet can be in a number of formats and shareholders funds can be on either side of the equation provided the maths is correct. Practically speaking it is always shown at the bottom and generally alone (this equates to the right hand side of my equation).

Statutory Company accounts published in both the UK and US must follow one of the formats set out in various legal acts. The Brambles accounts are in statutory format but the Anglo American, being taken from the Annual Review and not the full accounts, are not. But they are both “balancing” balance sheets. The Anglo American example have only shown one side of the equation and have substituted “Total shareholders’ funds (equity)" for “Net Assets” in the Brambles example. But you can see that because they have kept the maths correct the Total Shareholders funds equals the Net Assets and as Anglo American have not been bothered to split up the shareholders funds into its constituant parts there was no reason to show the "other side" which would simply been one line saying "Shareholder Funds £24,998".

Hope this helps

Gerard
 

Attachments

  • Brambles.gif
    Brambles.gif
    79.7 KB · Views: 839
  • Anglo American.gif
    Anglo American.gif
    89.3 KB · Views: 773
how important do u think the pe ratio is ...with blue chip stocks ..cheers :)
 
Last edited by a moderator:
agree
Picking individual shares
Many brokers publish regular 'watch lists' of shares worth considering. A typical list will contain two years of estimates for factors that are considered indicators of a share's future performance:

Price-earnings ratio: The PE ratio is an indication of the market's anticipation of future earnings and of the quality of past earnings. The ratio indicates the number of times the share price covers the earnings per share over the previous 12 months, so shares with a low PE ratio are likely, over time, to outperform those with high ratios. For example, if a company has shares valued at $8.50 and company earnings of 28.5 cents per share, its PE ratio is:


8.50
285
= 29.82


The PE ratio is commonly used to show how attractive a share is to investors and to compare one company with another.
By looking at the way the PE ratio is calculated we can see that it increases as EPS decreases and as share price increases. A high PE ratio indicates that the share price is high relative to its current earning power, possibly indicating that the stock is over-valued and that a ‘market adjustment’ (that is, a rapid fall in price) might be expected. Alternatively, it might indicate that the company has good prospects for growth – so investors are prepared to put up with low earnings for now in the expectation that these will increase in the future.

This snapshot view of Makeshift Construction does give us some important information about the company. But most indicators of company performance, including the Div yield % and the PE ratio, are best viewed over time, so that trends in performance become evident. For example, while the Div yield % for Makeshift Construction is quite low at the moment, it may be moving upwards.

Even at their best, though, market indicators only tell us about what has already happened, not what will happen in the future.
Following the investment advice of your stock broker—or your neighbour—can take you only so far. In the end most people want to delve deeper into understanding any stocks that they are considering.

This requires knowing more about their “accounting numbers”. The first place that you can see these are in the share columns of newspapers. They come in two types, absolute numbers and ratios. Absolute numbers describe specific quantities and are usually in dollars and cents. Ratios occur when one number is divided by another number.

The current share price is an example of an absolute numbers. On its own it doesn’t give any useful information. To make sense of absolute numbers, they need to be compared with other numbers.

For example, many newspapers will also list the high and low price for the year. By comparing the current price with these prices we can tell whether a share is trading at the top, in the middle, or at the bottom of its 12-month range. At the moment, all the banks are in the top half of their 12-month price ranges whereas Harvey Norman is in the bottom of this range.

Dividend per share is an example of an absolute number. When it is divided by the share price it is called dividend yield and is an example of a ratio. Some newspapers list both the dividend and the dividend yield. Consider Telstra. Its price is around $5.30 and it paid a dividend of 33 cents over the past year. This gives it a dividend yield of 0.33/ 5.30 = 6.2 percent. (The average for the market is 3.7 percent.)

A further pair of numbers listed in many newspapers is that of earnings per share (EPS) and the Price-to-Earnings ratio (PE ratio). The total income of a company is called revenue or sales. What is left after paying expenses and taxes is called earnings. When this is divided by the number of shares outstanding, we are left with EPS. I like to think of EPS as the money earned by the company on my behalf for each share that I own.

But once again, since it is an absolute number, it needs to be compared with some thing. For a start it can be compared with the EPS for previous years. If you are intending to invest in a company, one thing to look for is how much the EPS has been growing over the years.

Price divided EPS is called the PE ratio. Examples of low PE ratios are A.V. Jennings and Tap Oil at 5.06 and 5.57. Examples of high PE ratios are Spotless and Computer Share at 44.99 and 47.97. The average for the market is around 17.3.

When people purchase shares with a high PE ratio they are doing so on the belief that the earnings are going to rise rapidly. If that doesn’t happen, the price can drop very suddenly. On the other hand, shares with a low PE ratio may not grow as fast but they can be steadier.
 
I see we are getting the PHD types back .

bet they don't believe in the maxim : less is more .
 
a lot of them clearly go by the maxim - why use one word when you can use ten !

' the cosine if the sine divided by the trident to the power of 5 summed by sigma will be equal to the reward to risk . '

something like that , makes you wonder why they do it.
 
bit harsh, wisestguy, considering people were being helpful in answering your question.

ungrateful springs to mind.

cant think why.
 
A currency swap is normally a medium to long term contract and can be considered as an exchange of loans in two different currencies between two companies. The motivation is often to exploit the companies different borrowing capability in the two currencies. A hypothetical and slightly simplistic example:-

A large european company wants to undertake a project in the US. Setup costs and long term income will be in $. They can obtain relativley more advantageous rates issuing bonds in Euros in their local market. So they issue Euro Bonds recieving large lump sum in Euros with commitment to pay coupon in Euros. They undertake currency swap so they have a lump sum in $ to fund the project and can pay interest payments from their $ revenues. At the end of the agreed term they wil pay pack the loan principal in $ and recieve back their Euros to mature the bonds. Exchange rates for the capital amounts are normally fixed, I think, to be the same at the start and end. Both participants stand to win or loose either from movements in interest rates or exchange rates.

Deals can be very complicated in practise with interest being either fixed rate or floating rate on either side(adding the risk/opportunity of overall rise and fall in rates not just the relative rates of the two currencies) and the loan amount stepping up over a few years then being paid back down like a repayment mortgage to fit the funding profile of a project. It is not normally just a straight speculation on the long term markets but is used to exploit different companies relative strengths in borrowing in different markets and for different durations.

Hope that helps

Gareth
 
FetteredChinos said:
bit harsh, wisestguy, considering people were being helpful in answering your question.

ungrateful springs to mind.

cant think why.


not ungrateful in the least.
jumping to conclusions more likely to jump up at you .

I was refering to the post which were NOT in reponse to my question.
 
Well then might I suggest you say "Thank you" occasionally, instead of always being on the offensive?
 
yeah OK , but I think you know that's not what I'm really after .

these are more corporate loan / FX deal / swaps . not really the short term stuff I was alluding to.

it's more when a bank already has a ST exposure to FX risk , like when they have a lot of FX denom. FD's.

when they want to cover this , then as I said in #1 , it may involve a currency swap and a forward rate deal.
 
frugi said:
Well then might I suggest you say "Thank you" occasionally, instead of always being on the offensive?

excuse me ?

surely if the contributers wanted expressed thanks they would say so . why do you feel the need to suggest , I find this rather bizzare.

anyway that's corny . we are adults here , at least I hope so , the real thanks comes when I post more original articles as said.

always on the offensive ? come on now , there's been far worse than that on the board.
 
Top