The FTSE looks as if it is about to tank...

madasafish

Well-known member
Messages
470
Likes
5
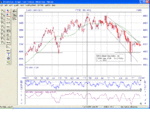
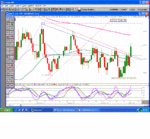
Attached are two charts of the FTSE100: one for several years incl the 1998
LTCM crisis and one for the past 6 months.


Looking at the years one first you can see how the McClellan Summation
Index - market breadth - fell rapidly in 1998 and then just as quickly
recovered.
In Sept 2001 it fell again to nearly the same level and then started to
turn down again. Also note the widening downtrend since October 2000 the
troughs are getting deeper and the highs lower... and the 200day MA in
green. STIX is turning up over 55 is overbought...

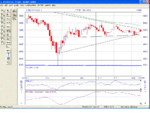
Turn to the daily chart: see again the decent from 2000 and the ascent from
the September low and the near horizontal line through recent lows at just
over 5050. They all intersect in about 2 weeks time .

Again we have a classic descending triangle with lower highs if the base
goes then the likely fall ids the height of the triangle as a minimum so
back to 4600. And bases usually only last 4 attempts and after that break
out..

See how market breadth is turning down and STIX is getting to overbought
levels..
 

Attachments

  • ftseyears.gif
    ftseyears.gif
    109 KB · Views: 775
and here is the short term

apologies for two posts...
 

Attachments

  • ftsedays.gif
    ftsedays.gif
    93.2 KB · Views: 717
madasafish - Interesting post. The indicators I tend to use for trading the indices on Sharescope are the stochastics set at 8,2,3 and the Macd set at 5,8, 5.
The indicator you use on your chart above, STIX, where is that on Sharescope and where can I find it ?
 
Right click
Add Market graph
STIX (at botom)


I also look at MACD etc but the ones above are longer term..
 
FTSE 100 2nd March 2002

Poised for recovery?

No doubt I have bored everyone over the past 2 years with my bearish outlook. Indeed only 2 weeks ago I wrote that the FTSE 100 was in a descending triangle with a base at 5000 and it showed every sign of wishing to break down.

Since then, however, we have seen real signs of potential recovery.
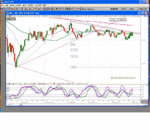
1. The FTSE has not broken down through 5,000 (well not yet) and it is consolidating in a trading pattern which suggests a move up from a base of 5050 to 5250 . This would break the downtrend line from the January 2002 highs and more importantly the longer downtrend from 2000. (the dark and red descending lines parallel to each other at the top of the FTSE2 March chart. More importantly it would breach the 200day MA shown in purple at the top of the chart. Once that is broken and holds above that level the bear market has ended.. officially.
2. The FTSE2March ss chart shows the last 5 months with key market indicators attempting to turn up. The McClellan Summation Index – a key long term market breadth indicator – shows the down turn after the runup after September 11th is attempting to flatten and turn. And The Overbought/Oversold indicator has gone from very oversold in October, to overbought (>200) in January to neutral (o) now. STIX is turning up.
3. There are lots of very pessimistic noises which are key market turning indicators. Sales of ISAs are at all time lows due to private investor pessimism. Pension funds are reported to move from equities to bonds. These are all classic moves by people and institutions whose reaction to market trends can best be likened to the old fashioned view of the dinosaur – they were thought to be so sluggish that a bite on one’s tail would take 5 minutes to reach its brain . (I know that’s no longer the current view but it’s such a nice analogy I could not resist it).
GNI were advising all their customers to short the FTSE if it hit 5200.
This wide spread pessimism is – in my view – indicative of the tail end of a bear market. All these people were hopeless optimists largely for the past 2 years. Which pension funds sold out at the top or near it? None. And they are all proposing to sell near a bottom! Professionalism? Market timing?
4. And take a look at a chart of the FTSE Techmark. (No I have not shown one..this is only for those interested). It is showing a potential double bottom.

5. The Coppock long term IC indicators have turned to buy on UK and US markets.

6. It is clear economic recovery is starting in the US Germany and (very slowly) in the UK.


Opportunities

Look at the most beaten down and unloved sectors for cheap shares. When cheap I mean cheap on fundamentals. The worries over debt are overdone and if debt to equity ratio is less than 50% ish can be ignored. Any company which was profitable or has cash twice market capitalisation, has not got a hopeless balance sheet and is trading on a Market Capitalisation less than 1/5th of its Annual Turnover has got to be a potential BARGAIN on a 1 to 5 year view.

Why? Well assuming it does not go bust or is a basket case and is not drowning in debt , in good times it should make post tax profits of 4-7% of turnover. Apply a PE of 10 and its Market Capitalisation should be 40-70% of Turnover.. and if its only 20% or lower..then the scope exists for the price to double as a minimum.

Throw in market growth as the economy recovers, possible takeovers and we could see a recovery in share prices over the next 3 years of possibly 3-5 times..
 
Nice post
I too, have been watching this chart for some time.
The supply(down trend) line is VERY strong; long time scale with lots of points of contact.
Most chart patterns breakout around 2/3 or 3/4 along the pattern. If it gets to the "point" then who knows where its going?

I also agree that when "most of the experts agree; then they might well be wrong " - (who said that?).

You have not mentioned - or I missed it - the nice Fibonacci fit for Sept 2000 to Sept 2001 fall in the index. FTSE has been in the 23.6/38.2% channel since October 2001.

However none of this tells us where FTSE is going for certain, only that there is pressure building. My gut feeling says that we are going to see the breakout to the upside as your last post suggests but I'm still sitting on my hands at the moment (and my cash)

Peter
 
Spot on, MF...broke out, next move seems to be breaking through 200 day MA and turning it into support...we'll have a clearer picture when you update your chart...

Riz
 
Last edited:
Updated:

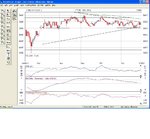
well: it has broken the downtrend line: now will it hold?
Odds are it will retrace .. to about 5198 or 50% of today's move...
 

Attachments

  • ftse4march.gif
    ftse4march.gif
    143.7 KB · Views: 428
Top