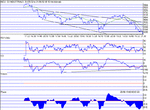
The DOW this week 17/06 - 21/06

ChartMan

Legendary member
Messages
5,580
Likes
47
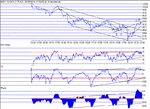
Phase turned nicely positive, but sitting at a channel top? Looks to be as far as we go short term....look at arrowed trend line. Is that really resistance it's banging against? Plus side is the triangle/bull wedge on RSI /CCI that has formed.Top side res 9750...
100MA: 9605. Support: 9660,9630,9600,9575,9528. Resistance:9706,9750,9800.
 

Attachments

  • dow170602.gif
    dow170602.gif
    15.8 KB · Views: 597
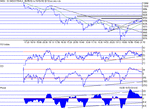
We failed to break out from the rising resistance line and Phase is getting well divergent since yesterday.This is not an easy call as there is another possible trend line that would act as support to the up-trend....Dificult call. One could take the contrarian view that it has failed to fall on weakness.
100MA: 9635. Support:9706, 9696,9660,9630,9600. Resistance:9750,9800,9832,9900.

AM update- dow down 100 overnight- bad results from Apple and Nikkei down 3%......
 

Attachments

  • dow180602.gif
    dow180602.gif
    14.7 KB · Views: 511
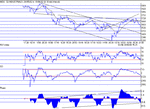
The divergent phase proved descisive again. Early action suggested a bottom at 9625, but the subsequent push up failed to break the trend of the rolling top. The remainder of the day slid slowly down to close at 9561. The overall Phase picture still shows positive divergence in the up channel, but this is now sitting firmly on support. Difficult to see any up side from here unless something gives....
100MA: 9633. Support:9532,9475,9432,9372. Resistance: 9584,9600,9632,9650,9664...
 

Attachments

  • dow190602.gif
    dow190602.gif
    15 KB · Views: 448
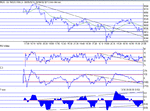
Just a short report tonight. The 10 min phase has just dropped down through the support line and the price has dropped through horizontal support at 9475. If this is a rounded top, it should be followed by a four slope change. So far I only see two....There is a possible RS switch too that indicates support at sub 9350.If this is to perform , I would not expect much more downside.
 

Attachments

  • dow200602.gif
    dow200602.gif
    16.2 KB · Views: 437
More and more down and more to come.Bear flag target suggests 9100 and yesterday's target of 280 fell at the end of the day and so I guess it's reasnoble to assume 9100 will follow. CCI still shows divergence,offering some hope.....but phase is confirming the downside.If this is going to be a 4 slope change before the bottom ,there is a long way to go....
100MA: 9423. Support- none. Resistance -9280.....brick wall as was 9472.
 

Attachments

  • dow210602.gif
    dow210602.gif
    14.6 KB · Views: 367
CCI

Just a question Chartman.

I was wondering what period you use for CCI?

I've been experimenting with a 14 day CCI for intraday trading of US stocks on a 5 minute chart, and have found that the divergences can be quite useful for fading moves.
 
CCI = 90......seems to be the value for AIQ charts. On Sierra Charts, using 90 bears no resemblance...
 
Top