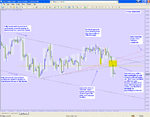
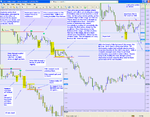
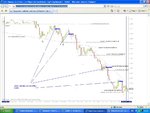
My take on the charts is attached. One 4 hour time frame, because I see the 28th and prior days as key in showing market particpants prior reactions. And one shorter time frames.
This is what I kind of see in my head, although I don't know how "real" this is. Price is decided by an auction process. Buyers want to get the lowest price possible, and sellers the highest price. A straight up straight down movement happens because a buyer takes up all the available merchandise, and any resting at higher levels until the need for merchandise is satisfied - and then fresh sellers keen to sell, put their merchandise on sale at lower levels, competing amongst themselves to get merchandise away. This happens on all time frames depending on the urgency with which particpants want to acquire or dispose of merchandise. On a 15 min chart, this could be seen as a hammer bar, and on a 5 min this process would be a straight up, and then a straight down bar in quick succession. Particpants also have different "needs" for the merchandise. If you are a US merchant bank, buying a UK company for pounds to a set timetable, you have got to have Sterling by a certain time point. If you are a US hedge fund, and all your mates are getting out of the carry trade because collectively, your community is getting spooked by interest rate rises in Japan, (and because everything you spent those yen on is losing value quicker than you even thought possible), then you want to buy yen to settle your obligations before everybody else does. If you are me, you don't need to work to a timetable at all... 😆
What interests me here is that although I think in terms of "price" and price levels, I have not managed to "perceive" things in terms of "weak" and "strong" hands, although my way of thinking tells me they do exist, and that their interaction is key to how price moves get eventually resolved. Right now, I am in a position where I wait to see the resolution of the interaction, and jump on the flow from there onwards.
On that Friday, I took a look at the dailies and thought USDJPY showed more clear air below, and a potential for cleaner moves, whereas cable had the potential for a lot of futzting around on the multiple trend lines. Which I why I traded USDJPY instead.
On another note, 110% congrats to wasp for starting this thread, and to all other particpants for keeping this on track! For the last couple of weeks I had given up reading this site, it just wasn't worth the grief... but I popped in last night to find this gem. Very well done......