The Challenge

Fib, BT,

The reaction of the bund should be interesting on Friday following the ECB announcement (12.00 pm). Consensus is no change but look where the Euro is. Bad for a net exporter.

I reckon we'll get wild swings if rates are cut but equally, if held, the question then becomes "When?", creating uncertainty and thus, prolonged volatility.

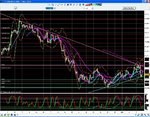
Attached is a one-minute chart of the bund following the Fed’s cut on 19 Sep. Note the low volume to the left of the volume spikes. Maybe lacking the Jackson Pollack feel of Fib's chart but the point is pretty well made. Gapped down 0.14 on open next day.

Grant.
 
Asymmetrical triangle on the hourly!
 

Attachments

  • Bund 031007 1hr.JPG
    Bund 031007 1hr.JPG
    270.9 KB · Views: 156
Correction:

ECB announcement today (Thursday), 12:45 BST
BOE also at 12:00 BST.

Grant.
 
I sent Grant a PM asking him for more information and he kindly replied with the following (posted with his permission):

I’m referring to number of contracts traded per time period, eg 5 minutes, 60 minutes, 1 day. I use this as measure of buyers’/sellers’ conviction.

For example, assume the bund has been rising throughout the day and your system gives a buy signal. Check the volume to see if this has been increasing with the price. If not, usually means lack of support or conviction for taking the price higher, and therefore possible underlying weakness.

If the price rises but on ever decreasing volume, watch for turn in the price (however, a lack of sellers – resistance - on a price rise on low volume may also be possible). Similarly, heavy or rising volume on a rising price usually indicates good support.

The converse applies to a sell signal/falling price.

As with all indicators, the rules are not concrete. A rising price with falling volume may indicate weakness but sod’s law dictates that if you ignore your buy signal, a flood of large buyers will suddenly come in and the price will rocket. Regardless, I reckon volume as an indicator will certainly supplement any indicator.

I’ve been trying to find an illustration from today’s charts but in vain. That’s life.


I'll be honest, I've largely ignored volume even though I have heard many traders say it is incredibly useful.

The main feed I use to watch the Bund does not supply volume data. However, from time to time I use another feed for historical data on the Bund (EOD only) and this does provide volume. I will take a closer look when time permits...
u cud use the futuresource workstationw hcih i think is provided by e-signal...it gives u loadson info including the volume charts n all...
 
the movt in bunds on tuesdya seemed to be giving strong bi=ullish signals..as in, i was watching it for almost the nentire day and the bids were hradly traded...most of the times it was the offers which ppl ewre trading at...but it did go down quite a bit on wednesday....but i dont think think it wud go below the 112 handle....wat say guys??
 
hey...
cud u briefly explain wat is the significance of this assymetric triangle?

thx

futures_trader,

Triangles show a series of lower highs and higher lows. The trendlines that connect these points show the price converging as it gets closer to the apex of the triangle. As this consolidation winds up many traders look for the price to breach one of these levels which can sometimes cause a sharp move.

This is from Investopedia:

A symmetrical triangle is generally regarded as a period of consolidation before the price moves beyond one of the identified trendlines. A break below the lower trendline is used by technical traders to signal a move lower, while a break above the upper trendline signals the beginning of a move upward.

Technical traders use a sharp increase in volume or any other available technical indicator to confirm a breakout beyond one of the trendlines.

The sharp price movement that often follows a breakout of this formation can be captured by traders who are able to identify the pattern early enough.
 
the movt in bunds on tuesdya seemed to be giving strong bi=ullish signals..as in, i was watching it for almost the nentire day and the bids were hradly traded...most of the times it was the offers which ppl ewre trading at...but it did go down quite a bit on wednesday....but i dont think think it wud go below the 112 handle....wat say guys??

I've had a difficult few days in the Bund...I will update you all in due course...

To answer your question: I think the chance it could go at least test 112 again are becoming increasingly probable after price rejected the daily TF PPZ at around 112.85. (see chart)
 

Attachments

  • bund1.jpg
    bund1.jpg
    82.3 KB · Views: 147
Direction, impetus and lead for the bund and bobl was the schatz today. See Word.doc attachment, bottom chart, specifically the break of the resistance level .

Strangely, caution seemed to enter the bund later (just holding the resistance level) despite the schatz pushing ever higher.

The ECB announcement caused barely a murmur, against my better judgement.

Grant.
 

Attachments

  • x.doc
    41 KB · Views: 196
Direction, impetus and lead for the bund and bobl was the schatz today. See Word.doc attachment, bottom chart, specifically the break of the resistance level .

Strangely, caution seemed to enter the bund later (just holding the resistance level) despite the schatz pushing ever higher.

The ECB announcement caused barely a murmur, against my better judgement.

Grant.

I really do need to watch these correlations...thanks for the information Grant - very interesting!
 
BT,

Of course, this is in a scalping context. Relevant to day-trading?

I would suggest apply your current daily tech analyses for the bund to the schatz; there has to be a high degree of correlation. At a guess, look for possible divergence(s)between the two, and whether this is corrected subsequently.

Personally, I prefer to use raw data in Excel for this. I'll have a look later and report back.

Grant.
 
Thought I'd post a Bund 1 yr chart with the US equivalent.

Both instruments are close to their respective pivots (i.e. key support).

Bund - Note the similar sideways consolidation? Coloured in yellow
Is this the beginning of a new downtrend?

US 10 year - Note the breakdown from what appears to be a rising bearish wedge. Coloured in orange.
Again, is this the beginning of a new downtrend?

In both instruments, OBVolume appears to be mirroring price action.
 

Attachments

  • Bund 071007.JPG
    Bund 071007.JPG
    258.7 KB · Views: 185
  • 10 yr US treasury 071007.JPG
    10 yr US treasury 071007.JPG
    206.4 KB · Views: 165
Guys, who here works in a bank? I work for a big investment bank and they don't allow us to do spreadbetting!!!! Who knows banks that allow it (as I don't want to change the field)?
 
Guys, who here works in a bank? I work for a big investment bank and they don't allow us to do spreadbetting!!!! Who knows banks that allow it (as I don't want to change the field)?

u want to change the bank because u want to spread bet ?!
 
Depending on how far up you are, it's going to be tricky, the best you can probably hope for is having to ask your boss every time you want to do something, and I doubt he/she'll be happy signing that off.
 
Top