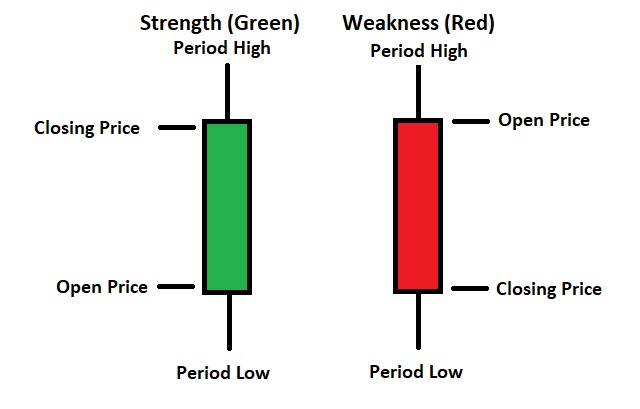
The problem is that many traders end their candle analysis there. You must look to see what the tails (wicks, shadows or whatever else you wish to call them) are telling you. These tails mark the highs and lows of the period. If I asked you what the candle below signifies, you might tell me weakness since it is red
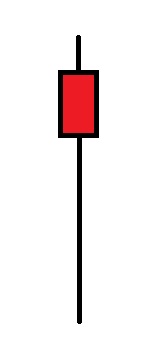
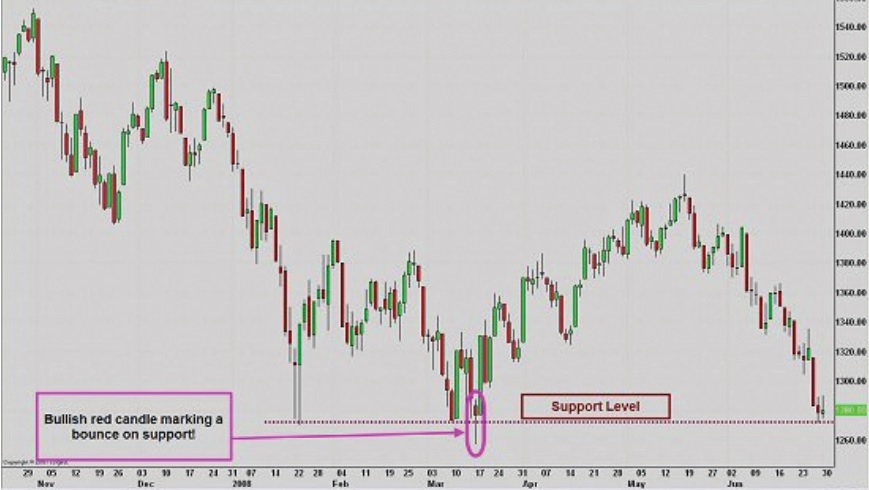
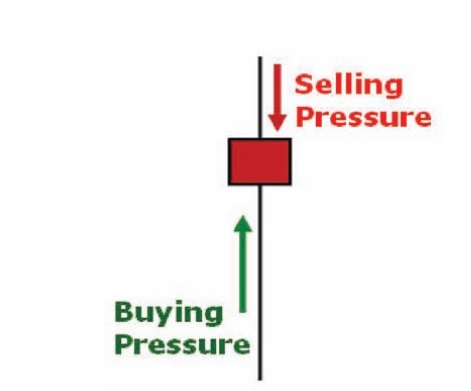
However with further examination, you will see that there is a long tail to the downside, which means that even though the bears pushed the price lower, there was enough bullish pressure to move price higher before the close of the period. # is is actually a bullish candle! Let’s see where it was in the big picture of the whole trend. A red candle actually indicated that we were ready to bounce off support with a lot of upward bullish pressure. You have to listen to the ‘tale the tails’ are telling you. Any candle tail that is above the real body (colored portion of candle) tells that the bulls were not able to hold price up and the bearish pressure moved prices downward. Any tail below the real body indicates buying pressure as shown in the following illustration.
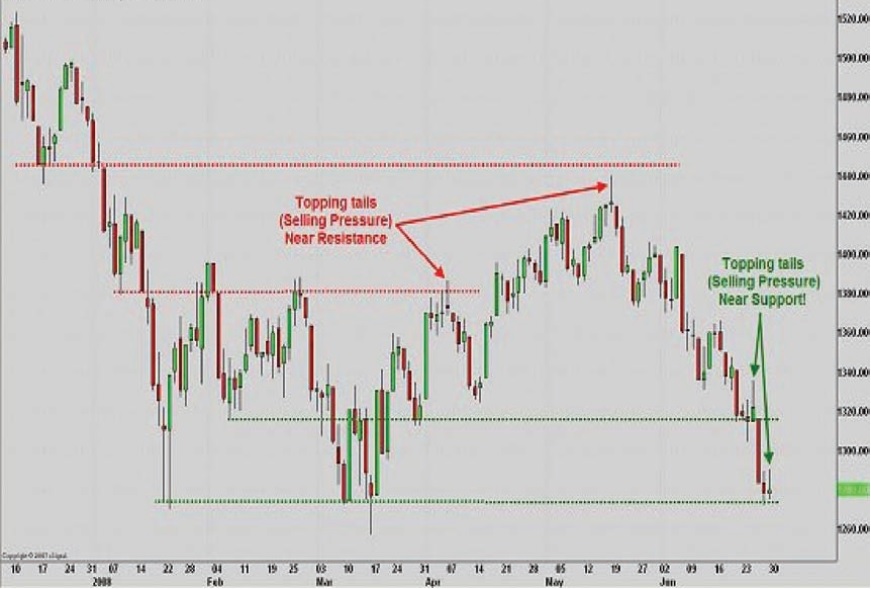
This becomes especially important when price is nearing a level of support and/or resistance. By observing which force is winning (bulls or bears), we can anticipate a bounce or break of that price level and take appropriate action. Remember that price gives us clues as to the immediate direction a market will go. We just have to be open to viewing it and listen to the ‘tale of the tails!’
Brandon Wendell can be contacted on this link: Brandon Wendell
Last edited by a moderator: