Support/Resistance/watch

ChartMan

Legendary member
Messages
5,580
Likes
47
The following are at or close to Support/Resistance. This is NOT inferring that they will rise or fall from these positions...

At Support:
BAA,BARC,BG#,BGY,BLND,BPG,BSY,CAP,CBRY,CCC,CCM
CED,CKSN,CPW,DXNS,EGS,EZJ,HAS,ICI,III,JMAT,JRVS
KWL,NTX,POC,PRH,RTR,SCR,TWT,UNIQ,WGC,WMPY
At Resistance:
BASS,BBA,CC#,CTC,DAG,DGE,EID,HBR,HFX,IAL,IMG,OGS
PIC,PJP,TWT

A watch list for breakouts.......
EID @296
KGF@470
MSY@620
PO#@275
SHP@1230
SOF@97
STW@1525

These stocks are all taken from my own "list".

Possible competition longs:
AMT,ATN,AU#,BARC,CAP,CCC,CED,CKSN,ENI,ENO,EZJ
FI#,GLD,IMG,KWL,LOG,PIC,SGE,SHP

Possible shorts:
AL#,CAT,DT,EID,FIB,MTN,PIZ,RBOS
 
Was this list generated with an EDS routine or the Mk1 eyeball?

Dave
 
Eyeball I'm afraid. Coding EDS to select my favourite chart patterns is totally beyond me, and probably anyone else.
However, If there are any mathematical WizzKids out there, I'm sure pattern recognition could be easily programmed in "C" or "Pascal" using OHLC data.
If anyone is interested, I 'm sure I coud provide the flow chart analysis........
PS did you find my selections worthwhile? I had a quick look mid-week and the breakouts looked to be mostly doing wel....
 
Breakouts

Martin

It would be interesting to know what methods you use to arrive at this selection. Do you simply go through your favourite list, looking at resistance/support levels of each stock?
Currently I am trying to work out a method of picking stocks with have broken upwards/downwards on daily basis.
 
Yes Zippy, I just go through my "list" usually over the weekend to do my competition selection.My selection is based on a number of criteria, several of which I would NOT use to select a stock to trade for real.One of these is trying to pick a true bottom. As part of my stock perusals, is to mentally note those that are at support/resistance, and those that may be on a triangle breakout...
 
I watch around 160 stocks and can give a daily info on these regarding support and resistance breaks.

Resistance break 11/5/01 REX


MX
 
Breaks of resistance 21/5/01

AVZ, BASS, DDT, DLAR, ETP, NVR, SOF.


No breaks of support in my list of stocks.


MX
 
MX

Thanks. I have been watching Bass and AVZ for a few days now. With regards to Bass, on 21st May both RSI Wilder and stochastic indicators were above 95 but now the indicators including TCI are decreasing thus in my opinion a downtrend is likely. A good "short" would you say!
 
Be careful with a short Zippy. Bass has broken out from a long term down trend with some considerable strength, on substantial volume.The long term down trend from July 98, ended on 27/03/01 with a low at 640 ish, this resistance becoming support. The trend had a long term down trend breakout at the begining of Nov 2000, confirming the switch from res. to support.We now have a new uptrend breakout of a "triange" last tested on 30/04 subsequently breaking out on 16/05, closing at 772, with all subsequent closes above the resistance line.This strength should keep the price above support, leaving only 25p from Friday's close to support at 761. I'm not saying it can't be a short, but the risk to reward has to be very small here.On the other hand, the R/R for long is good.Upside target resistance I would say is 835/845 ( 50p) with a downside of 20p.Next stop up is 1,000p. Bass is quite volatile (relatively) having the ability to move 10-15% in a week quite easily.First target would give 7.5% m the second over 20%.
There is some stong fundamental news associated with BASS which you should research in conjunction with this TA. I think they sold all their brewing concers.....
Just as a final note, don't enter long below 785/780.
 
Bass

Thanks for your comments Martin. I shall look at the charts again. By the way I am paper trading some of these stocks, so easy with paper trading.
 
Zippy. Take a look at SCTN from a long term point of view.... 3-6 months, say and tell me what you see.
 
SCTN

Hi Martin

SCTN has been in a downward trend since 31/03/98 hittting lowest point on 15/02/00. However, it went up to 579 prior to entering FTSE100 last summer on 23/05/00 and reversed the trend dipping as low as 392 on 20/09/00. I saw it as high as 537 on 29th November but it dipped again after the results. Since then it has been in an upward trend forming a strong support @445 around 31/01/01. It has now formed a very strong support around 480 but recently has been making higher highs. Once it breaks the resistance at 520 it will head for 540, thereafter 560-575. I can see it going higher in the next few months.
Please note I have love/hate relationship with this stock as I bought it at 530 last summer, it fell right down to 392. I stayed in it as I had no idea about stop losses in those days but fortunately for me it paid dividends twice and I was able to come out at the buying price. Lesson well learnt hence I turned to TA.
 
Spot on Zippy! In fact I missed minor resistance at 520!
The reason I asked your opinion was to see if you could see the potential Triangle/Wedge formation, from June 2000 onwards.The TA on this pattern is well documented, giving 2 taget prices,depending on your interpretation of the pattern and the "top Line". One target is 688, the other is 775. I favour the latter, as it coincides with prior major resistance at that price (23/04/99 and 2 others just prior to that).
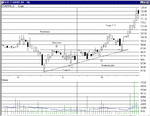
For a "classic" example of a wedge breakout, look at Somerfield (SOF).The top line is at 97, from 20/03/01 , the low point is the same date at 82p giving a breakout target of TopLine+ (topline - bottom) = 97 + (97-82)= 112p. Total triagle length = 43 trading days with breakout at 30 days = 70% of triangle length. TA says breakout length is usually 60-75% of total length.A solid breakout went to plan, with a mysterious drop below support on 16/05, and then on to 122.I suppose you could argue 107 was sufficiently close to the theoretical target of 112 to be valid...especially if you ignore the "exceptional low of 82p at the "mouth" of the triangle and instead use the "normalised" low of 85p.It's all theroetical anyway, ant to my thinking, "near enough is good enough".
BAY is similar, but has yet to perform to target, but it's well on the way. Base line at 358, low at 294 on 04/04/01 giving a target of 420p.
Nice to see you enjoying TA, getting it right and, hopefully, reaping the potential rewards.
 
Martin

Thanks for your interpretation. I am not very confident with triangles, wedges and mathematical workouts of chart formations. Are you able to take me a stage further please?
 
Find attached a classic triangle breakout chart for SOF ( Somerfield). The price forms a Low at the "Mouth" of the triangle.The price then bounces up and down between support ( rising line) and the "Base"- which is a straight line.There should be at least two excursions to the limits in both directions to form the "Wedge". The target price is calculated as Base + ( Base-Mouth). This is true for and price and slope of support.This gives a "breakout target price" of 112p.It is not usual for the price to break the base line after breakout, as it did in this case.The breakout occurs approximately 60-75% of the wedge's length- from the Mouth to the point where Support touches the Base Line. In real time OED, you will not know where this point is- you will have to guess it! Ideal entry point would have been between the 20th and 30th April. My son got in on the 11th at 89p- a tad early, and a bit on the "gamble" side.but it's paid off nicely.
Other examples are BAY,SN#,GAW.MGGT
HAS, HSBC, IBT,SGE,TBI are in the process of forming...

Hope this helps.
 
Forgot the chart...
 

Attachments

  • sof breakout.gif
    sof breakout.gif
    14 KB · Views: 257
Yes Zippy nice bull wedge too. It's in my "hot list".
BASS too , but LONG term wedge going back to Dec 99
 
Top