Summarized_trader_dante_(without permission :-p)

everyonerich

Experienced member
Messages
1,109
Likes
43
i will try to make a summarized version of this thread, so that its easy for myself and everyone read back for those who are interested. PLEASE note : i tried not to modify or add anything mostly i just copy paste the author's word.

Original reference here:
Code:
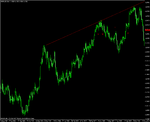
http://www.trade2win.com/boards/first-steps/26947-making-money-trading.html

1.) Draw trendlines : daily timeframe chart only

* trendlines needs three touches to be valid

73520d1263477128-picture-links-01.png


------------------------------------------------------------------------------------------------------------------------------------
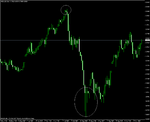
2.) Also look for other possible trendlines

- The one I have drawn on the chart is, in my opinion, not valid yet.
- I am drawing it on the chart because it connects the most recent swing lows and I want to see if the market will react to it at a later stage.


73510d1263476297-picture-links-02.png


------------------------------------------------------------------------------------------------------------------------------------

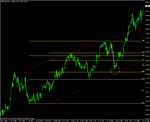
3.) Draw Support/Resistance line

- What I am looking for is obvious pivot areas where previous resistance has now become support and vice versa. Take note the arrows as well


73512d1263476425-picture-links-03.png


------------------------------------------------------------------------------------------------------------------------------------
4.) Look for more S/R

- ignore minor S/R
- find the areas that the major players are going to be looking at. It is these major levels that the price has a high probability of reacting to in the future.


73514d1263476531-picture-links-04.png


------------------------------------------------------------------------------------------------------------------------------------
- another S/R : It is not as immediately clear as the other two but it stands out to me nonetheless.

73516d1263476595-picture-links-05.png


------------------------------------------------------------------------------------------------------------------------------------
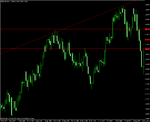
The final touch I have to make to this timeframe is to add in a level that hasn't been tested yet but which I think may be. This is the top horizontal red line in this chart and I have drawn it there because it joins the two recent highs that price broke out of.


73518d1263476630-picture-links-06.png
 
Last edited:
More examples

-find a market, draw trendlines & S/R (1.3551)


73528d1263480287-picture-links-08.png


---------------------------------------------------------------------------------------------------------------------------------------
-second S/R (1.3613)


73530d1263480537-picture-links-09.png


------------------------------------------------------------------------------------------------------------------------------------
- adding third S/R (1.3689)


73532d1263480782-picture-links-10.png


------------------------------------------------------------------------------------------------------------------------------------

* Note- for the following picture, i thought trader_dante advice entry with fibonacci confirmation also, but seems he didnt provide much info about 'perfect' trade or high probability setup he mentioned before. and he said we have to assume we did enter long in this pin bar


73534d1263481556-picture-links-11.png


First thing you see is that price hits our pre-drawn line and retreats.

That resistance (which in all fairness we would have expected) could have been used to take profit for a risk/reward of around 1:1 OR it could simply have served as a warning sign to tighten your stop to break even which should be just past the high of that pin.

But if you are very confident you could keep your stop where it is. Something I have found in my experience is that when price breaks a pin bar higher/lower, it will often retrace to the breakout point before continuing on. If you are too quick to get your stop to BE you could end up being shaken out.


-------------------------------------------------------------------------------------------------------------------------------------
 
Last edited:
~

In this example, if you had moved your stop to break even, you would most likely just be hanging onto this trade. Sometimes you will get stopped out and price will move on higher without you.

Believe me, I know how frustrating this can be but never chase the market. If you are shaken out of a trade and the market moves off, wait for another optimal place to get on board.

There should be a good and clear reason for entering any trade. This should be at a turning point - what I refer to as a pivot point. A very good reason for this is that it allows for a clear idea of where to place your stop.

So, back to our example. Let's assume we are still in this trade.

Price responds well, moves up through the second resistance in one sharp move and then stalls at the third.

Again this could be a chance to take profit or time to tighten your stop.

As I trade these setups live, I will show you what I do. I play these somewhat instinctually in terms of exits and this comes from my experience.

73538d1263482028-picture-links-12.png


--------------------------------------------------------------------------------------------------------------------------------------


Look closely at this chart. Many traders would be shaken out of this trade if they didn't take profit at that third level on the chart.

When we look at a chart like this we see a consolidation before the next leg higher and it looks rather easy, with the benefit of hindsight, to say we would have placed a stop BELOW the inital S/R break and then held the trade through this period of consolidation.

In reality, many market players would be stopped out as the market fell around 150 pips and for many of us, that is too much profit to give back to the market.

It is hard to say what I would have done since I wasn't in this but looking at the chart I think the correct thing to do would have been to trail the stop to just beneath the second support, so in this case we would be also out.

If we had been stopped out we would have been frustrated to see the market go straight back up and test the highs of the consolidation zone BUT, this chart perfectly illustrates why this shouldn't bother you. You never know what the market is about to or what it is about to offer you.

Soon after, the market comes back for a final test of our initial S/R levels and forms another pin bar. This S/R level has confluence with the 50 fib from the swing low to the consolidation high.

This pin made another excellent entry into the trend.


73540d1263482322-picture-links-13.png


------------------------------------------------------------------------------------------------------

- another potential setup (previously)
- the redline is S/R + fibonacci level

73544d1263482500-picture-links-14.png
 
Last edited:
~
Price had retraced a little deeper than any fib level from the last swing low but if you draw fibs from the two prior swing lows you will see that the 61 of the first and the 50 of the second are literally on top of one another. And the nose of the pin bar touches them.

This is confluence. And it is very powerful. Other traders are watching these levels and the pin bar is a heads up on what they are doing.

The psychology behind the pin bar is simple: in this case, price fell and then was met by significant buying support which caused a rapid reversal and a close near the highs.

This validates your pre-drawn lines.

Whenever I see a pin that touches a pre-drawn line almost to the very pip, I get strong confidence in the trade. Why shouldn't I? I have analysed the market and drawn on a pivot and the market has shown me that at least temporarily, I have been proved right. Once the pin is then triggered it means price is still going in my favour.

This is an important part of gaining confidence in your trade.
 

Attachments

  • 08.png
    08.png
    25 KB · Views: 146
~
Let's imagine we were going to take this pin live now.

I would go through the chart and mark all the areas where I think price may stall or run into difficulty.

Obviously we are looking to be filled in a long position (when the market breaks the high of the pin) so the areas we are trying to pinpoint are going to be overhead.

Here is the first one based on previous support/resistance areas.

Again remember - look for the most obvious.
 

Attachments

  • 09.png
    09.png
    22.1 KB · Views: 131
~
Here is a possible second.

Drawing these is more of an art than a science. Look for areas where the price was rejected and areas where it bounced.

The reason this particular S/R level was drawn here was that I am favouring the large bounce (far right arrow). This to me was a strong support and since we know these levels flip, has a fair chance of becoming future resistance. It also coincides with two large rejections (far left two arrows).
 

Attachments

  • 10.png
    10.png
    22.1 KB · Views: 144
~
Final level I would draw for now (at least until the move gets underway if it does at all) is this top one.

The trader is now prepared to take action if price confirms that any of these lines are correct.
 

Attachments

  • 11.png
    11.png
    22.1 KB · Views: 129
Erm, are you not just basically going over the entire thread again? People can just read the original...
 
~
Now lets presume we took this trade long.

First thing you see is that price hits our pre-drawn line and retreats.

That resistance (which in all fairness we would have expected) could have been used to take profit for a risk/reward of around 1:1 OR it could simply have served as a warning sign to tighten your stop to break even which should be just past the high of that pin.

But if you are very confident you could keep your stop where it is. Something I have found in my experience is that when price breaks a pin bar higher/lower, it will often retrace to the breakout point before continuing on. If you are too quick to get your stop to BE you could end up being shaken out.
 

Attachments

  • 12.png
    12.png
    19.6 KB · Views: 143
Top