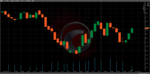
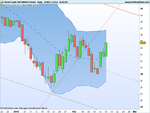
The second and third last candlestick from both charts look quite different. Why?
Hi Koga,
It's difficult to say for sure looking at the charts, but there are a number of possible reasons that might account for this.
1. Although both charts are of brent crude, are you 100% certain they are they same contract? I ask because, in the past when this issue has arisen, it was often the case that the member concerned was not comparing like with like, e.g. the 'spot' cash price with a futures price - or the near future with a distant future etc.
2. The most probable explanation is that FXpro and ProRealTime are using different data. Users of FX pro will be able to confirm whether or not the broker is a market maker. If they are, then they will be making their own price which is likely to be slightly different to everyone else.
3. Believe it or not, financial data is not always as accurate as one might imagine or expect. Data that's provided for free tends to have more glitches and inaccuracies in it than the high end bespoke data that comes direct from the exchange. The reasons for this are technical, to do with the way free data is often bundled together to make it faster to process and to reduce the burden on computer servers etc.
4. The start and end times for the day may differ between the two providers.
Tim.