You are using an out of date browser. It may not display this or other websites correctly.
You should upgrade or use an alternative browser.
You should upgrade or use an alternative browser.
- Status
- Not open for further replies.
dbphoenix
Guest Author
- Messages
- 6,954
- Likes
- 1,266
The tape is like a moving picture film. Every minute of the day it is demonstrating whether supply or demand is the greater. Prices are constantly showing strength or weakness: strength when buyers predominate and weakness when the offerings overpower the buyers. All the various phases from dullness to activity; from strength to weakness; from depression to boom, and from the top of the market down to the bottom – all these are faithfully recorded on the tape. All these movements, small or great, demonstrate the workings of the Law of Supply and Demand.
And now that you are undertaking to learn this Method, it is best that you prepare your mind for it by discarding most of the factors that you have heretofore employed in forming your judgment and making your decisions, such as: tips, rumors, news items, newspaper and magazine articles, analyses, reports, dividend rates, politics and fundamental statistics; and especially the half-baked trading theories which are expounded in boardrooms and popular books on the stock market.
It is not necessary for you to consider any of these factors because the effect of all of them is boiled down for you on the tape. Thus the tape does for you what you are unable to do for yourself; it concentrates all these elements (that other people use as a basis for their stock market actions) into the combined effect of their buying and selling.
You draw from the tape or from your charts the comparatively few facts which you require for your purpose. These facts are: (1) price movement, (2) volume, or the intensity of the trading, (3) the relationships between price movement and volume and (4) the time required for all the movements to run their respective courses.
You are thus far better equipped than the man who is supplied all the financial news, statistics, etc., from the whole world.
--Richard Wyckoff
dbphoenix
Guest Author
- Messages
- 6,954
- Likes
- 1,266
At its most basic, the SLA is about detecting and profiting from the shifts in dominance between demand and supply. All profitable trading methods are based on detecting and acting on these shifts. The SLA, however, goes beyond the hindsight trading default of these methods and offers guidance via its tactics regarding entrances and exits. This can be explained by means of a great many words or a very few pictures.
Beginning with the triptych above and picking up where the last segment ended . . .
Beginning with the triptych above and picking up where the last segment ended . . .
Attachments
dbphoenix
Guest Author
- Messages
- 6,954
- Likes
- 1,266
A reminder.
The purpose of this thread is to illustrate how the SLA -- a rules-based approach to tape reading, or "price action" -- works in re imbalances between supply and demand. If one doesn't understand the need for providing context, weekly to daily to hourly to intraday, then the document posted here may be of help. If one prefers not to read a 30p document, the rules linked above and the illustrations provided will have to suffice. If one is unable to look forward, i.e., past the right edge of the posted charts, and translate line breaks and retracements into trades, then he should investigate some other approach.
Db

dbphoenix
Guest Author
- Messages
- 6,954
- Likes
- 1,266
.What is the state of demand vs supply today?
How is it different from the state of demand vs supply yesterday?
What are the most likely turning points?
Attachments
dbphoenix
Guest Author
- Messages
- 6,954
- Likes
- 1,266
As no one has shown any interest in the DAX, CAC, FTSE or other non-NQ charts that I've posted (most recently, post 34, above), I won't be posting any more of them. Not that I'm crushed or anything, but I do have other uses for my time.
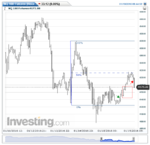
Before leaving this topic, however, I do want to point out that anyone who is interested in the FTSE and who also took the time to bone up on the SLA and saw the FTSE charts I posted above (again, post 34, reposted below) would have enjoyed a 330pt move. This is not a matter of "hindsight trading" but of understanding how a mean-reverting instrument behaves in an auction market.
Db
Attachments
- Status
- Not open for further replies.