4xpipcounter
Experienced member
- Messages
- 1,571
- Likes
- 30
MT--LT forecasts
Here's my LT--MT forecasts:
EUR/USD-- The daily kijun was hit today at 1.2172. The upside target is now the weekly tenken at 1.2603.
USD/CHF-- Bottom of the weekly cloud at 1.0318
GBP/USD--1.4993. Tehre could be a retracement afterwards. Eventually, 1.3837, YS2.
AUD/USD-- .7827-- bottom of the weekly cloud
USD/CAD-- 1.1411--top of the monthly cloud.
NZD/USD-- .6262-- weekly bottom of the cloud
GBP/JPY-- Once under 132.81, comfortably, then 119.80, YS2
GBP/CHF-- 1.5922--YS2
EUR/AUD--1.7525, the monthlky kijun.
EUR/CAD--Weekly close above 1.2996, then 1.4228.
AUD/JPY-- There is some sort of techncial difficulty on my chart for this pair. It will be the bottom of the weekly cloud
NZD/JPY--56.95--bottom of the weekly cloud.
CAD/JPY--79.34--bottom of the weekly cloud.
GBP/AUD--2.1654--monthly kijun.
AUD/NZD-- 1.1929--monthly kijun.
GBP/CAD--1,6361-- monthly tenken.
NZD/CHF--6994-- bottom of the weekly cloud.
DJIA-- Once there is a weekly lcose below 9,724, then it will be to the bottom of the cloud at 8,596.
All due respect, I was told earlier today that the ichimoku is only backward looking. Well, these forecasts are all looking forward. Refer back to this post # after they all hit.
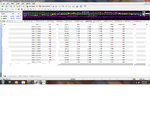
BTW, I opened an account just for my LT trades. Everyone of them are on my platform. After they hit, I intend on publishing the proof.
Don't worry. As always, no ulterior motive. I'm only proving the effectiveness of the ichimoku. Oooh, I love this.
Here's my LT--MT forecasts:
EUR/USD-- The daily kijun was hit today at 1.2172. The upside target is now the weekly tenken at 1.2603.
USD/CHF-- Bottom of the weekly cloud at 1.0318
GBP/USD--1.4993. Tehre could be a retracement afterwards. Eventually, 1.3837, YS2.
AUD/USD-- .7827-- bottom of the weekly cloud
USD/CAD-- 1.1411--top of the monthly cloud.
NZD/USD-- .6262-- weekly bottom of the cloud
GBP/JPY-- Once under 132.81, comfortably, then 119.80, YS2
GBP/CHF-- 1.5922--YS2
EUR/AUD--1.7525, the monthlky kijun.
EUR/CAD--Weekly close above 1.2996, then 1.4228.
AUD/JPY-- There is some sort of techncial difficulty on my chart for this pair. It will be the bottom of the weekly cloud
NZD/JPY--56.95--bottom of the weekly cloud.
CAD/JPY--79.34--bottom of the weekly cloud.
GBP/AUD--2.1654--monthly kijun.
AUD/NZD-- 1.1929--monthly kijun.
GBP/CAD--1,6361-- monthly tenken.
NZD/CHF--6994-- bottom of the weekly cloud.
DJIA-- Once there is a weekly lcose below 9,724, then it will be to the bottom of the cloud at 8,596.
All due respect, I was told earlier today that the ichimoku is only backward looking. Well, these forecasts are all looking forward. Refer back to this post # after they all hit.
BTW, I opened an account just for my LT trades. Everyone of them are on my platform. After they hit, I intend on publishing the proof.
Don't worry. As always, no ulterior motive. I'm only proving the effectiveness of the ichimoku. Oooh, I love this.