You are using an out of date browser. It may not display this or other websites correctly.
You should upgrade or use an alternative browser.
You should upgrade or use an alternative browser.
Some of my trades, forecasts
- Thread starter 4xpipcounter
- Start date
- Watchers 42
- Status
- Not open for further replies.
4xpipcounter
Experienced member
- Messages
- 1,571
- Likes
- 30
Cad/jpy
Between the 4-hour kijun at 82.34 and the WS1 at 82.04 should be ideal reversal points to get back in the UP towards the WR2 at 84.87.
Between the 4-hour kijun at 82.34 and the WS1 at 82.04 should be ideal reversal points to get back in the UP towards the WR2 at 84.87.
4xpipcounter
Experienced member
- Messages
- 1,571
- Likes
- 30
Jason, good question. When I say that, I simply mean to not take my word for the fact that my S&R's are highly effective-- for you to plot them on your demo, away from t your personal methodology, and watch my S&R's in action. Most of the time you will see a correction of at least 38.2% of the distance of that level to the previous level. Other times you will see a minor bounce, and then a continuation to the next level. If that happens, then you will usually see a correction from the point it continued to back to the previous point.
I never recommend anyone to take my S&R's and just start trading off them. There are some that follow this thread that use my S&R's to plan their trading decisions, but they have followed me long enough and have learned to trade with them to be effective with them. In essence, and again, do not take my word for how good they actually are, btu make me prove myself to you.
BTW, the way you know if you got the minimum 38.2% correction is to simply plot a Fibo between the 2 reference points.
Trading opportunities do present themselves at my S&R's for a quick correctional type of pips. Sometimes complete reversals ensue. I will use them to determine a reversal. This is when a trend has fully extended itself, and it is time for it to let out some steam. Sometimes, the reversal is a whole new LT trend. Other times, it is a MT correction within a trend. Then, there are other times it is a correction within a trend that is within a longer term trend. Considering my S&R's are not only supports and ressitance, but they also help in determining the range of a trend, and then in locating the points of exhaustion.
Here's a couple of good examples in order to dissimilate what I am talking about. The AUD/CAD was entered on a short at .9759. There is still potential for this pair to make it to the .9900's. The shorter term has it that the pair should be making a correction to around .9670. The overall flow of the price action, along with other factors showed me it was worth the chance to enter the trade and ride it south.
The NZD/USD was entered at .7268. This entry showed me the correction of the UP was completed, and then the UP will continue, probably to the MR3 at .7403.
BTW, for the NZD/USD, watch for the level at .7318. That is the WR1. My guess is we'll get a small bump off that point, maybe some slight consolidation, and then a continuation to the WR2 at .7387.
4x,
Sorry for any ignorance but when you say 'plot them on your demo and watch them live', what do you mean? Are you saying that effectively you should be buying at the S's and selling at the R's?
Thanks
4xpipcounter
Experienced member
- Messages
- 1,571
- Likes
- 30
Gbp/aud
The pair is already about to hit my WS2 at 1.6510. It is prepared for a correction back to at least the WS1 at 1.6592.
A move back to the MS3 at 1.6743 is not out of the question.
The pair is already about to hit my WS2 at 1.6510. It is prepared for a correction back to at least the WS1 at 1.6592.
A move back to the MS3 at 1.6743 is not out of the question.
Last edited:
4xpipcounter
Experienced member
- Messages
- 1,571
- Likes
- 30
Gbp/cad
Expect this correction to continue to the daily kijun at 1.5987, and possibly the WS2 at 1.5958. Afterward, it should be another strong leg UP. The bottom of the weekly cloud at 1.6351 will be challenging.
Expect this correction to continue to the daily kijun at 1.5987, and possibly the WS2 at 1.5958. Afterward, it should be another strong leg UP. The bottom of the weekly cloud at 1.6351 will be challenging.
4xpipcounter
Experienced member
- Messages
- 1,571
- Likes
- 30
Re: AUD/CAD trade GBP/USD
I just cloaed the trade for +23 pips. I don't like the way it is moving.
This laso freed up some margin for cable, as I am long at 1.5586. I was a little late in entering, but here we go anyway.
I just cloaed the trade for +23 pips. I don't like the way it is moving.
This laso freed up some margin for cable, as I am long at 1.5586. I was a little late in entering, but here we go anyway.
I went short at the MR1a at .9759. There shold be a pullback to around .9670/ I have to use my "a" levels only for this pair. This pair is on my live platform, but not on my demo platform that more accurately plots my S&R's.
4xpipcounter
Experienced member
- Messages
- 1,571
- Likes
- 30
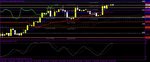
The hourly chart is looking at loads of R with tenken, kijun and the cloud right over its head. It's doubtful a reversal will take palce and it will continue DOWN. That would not be the ideal situation for a short. A move back to the WR1 at 83.93 is what would be the ideal short.
Attachments

4xpipcounter
Experienced member
- Messages
- 1,571
- Likes
- 30
NZD/USD trade
Here we go again. .7280 is where I jumped on board to head north again.
Here we go again. .7280 is where I jumped on board to head north again.
4xpipcounter
Experienced member
- Messages
- 1,571
- Likes
- 30
4xpipcounter
Experienced member
- Messages
- 1,571
- Likes
- 30
Gbp/jpy
I'm taking this pair north, too. I jumped in at 133.37.
I'm taking this pair north, too. I jumped in at 133.37.
Last edited:
4xpipcounter
Experienced member
- Messages
- 1,571
- Likes
- 30

4xpipcounter
Experienced member
- Messages
- 1,571
- Likes
- 30
Usd/jpy
This pair has gone sideways long enough. There is a possibility we could see a dip to 85.07, but that is doubtful. The pair is getting ready to blow out the recent peak, and stake its claim further up north.
I have no room for this pair, or I'd be going for the ride too.
This pair has gone sideways long enough. There is a possibility we could see a dip to 85.07, but that is doubtful. The pair is getting ready to blow out the recent peak, and stake its claim further up north.
I have no room for this pair, or I'd be going for the ride too.
4xpipcounter
Experienced member
- Messages
- 1,571
- Likes
- 30
Jason, at the time of the post, I was not actually expecting it to go UP further. Current level that it is rigth now would have made for an ideal short. It has been punching it out with my WR3 at .8468. The reversal is getting ready.
In the next post, I'll give you both the weeklies and monthlies.
In the next post, I'll give you both the weeklies and monthlies.
4x,
So you are expecting EUR/GBP to go up? Do you have the S& R for this pair?
Thanks
4xpipcounter
Experienced member
- Messages
- 1,571
- Likes
- 30
Jason read them left-to-right, R3,2,1, S1,2,3:
Monthlies: .8488, .8386, .8326, .8204, .8143, .8041
Weeklies: .8468, .8407, .8370, .8298, .8262, .8202
BTW, an even more ideal reversal would be at the MR3. That would consist of a strong R, along with a spike through the WR3 after the continuation with no harm done.
Monthlies: .8488, .8386, .8326, .8204, .8143, .8041
Weeklies: .8468, .8407, .8370, .8298, .8262, .8202
BTW, an even more ideal reversal would be at the MR3. That would consist of a strong R, along with a spike through the WR3 after the continuation with no harm done.
4x,
So you are expecting EUR/GBP to go up? Do you have the S& R for this pair?
Thanks
4xpipcounter
Experienced member
- Messages
- 1,571
- Likes
- 30
Gbp/chf
This pair is prepaing for another reversal north. Current level could be it. OTOH, we might see drop to the WS2 at 1.5473.
This pair is prepaing for another reversal north. Current level could be it. OTOH, we might see drop to the WS2 at 1.5473.
4xpipcounter
Experienced member
- Messages
- 1,571
- Likes
- 30
Closed trades on cable and kiwi
I close my positions on GBP/USD at 1.5683 for +97 pips, and the NZD/USD at .7374 for +90 pips, for a total of +187 pips.
BTW, we had a conversaton in another thread about gains. There was talk in there about certain percentage of possiblites, et al. The talk also revolved around 20% per year being a good return. To make a long story short, I hope a few from that thread accepted my invitation to read this thread. Just these 2 trades alone made 17.8% on my account. I'm not bragging. I'm just trying to make a point that if you take the time to learn a good methodology to trade by, you can make those returns on a regualr basis. I told them 100% per year is nothing.
Those trades, btw, were posted in posts # 966 and 968
4xpipcounter
Experienced member
- Messages
- 1,571
- Likes
- 30
GBP/JPY trade
I went long at 132.01. The pair has found support with the 4-hour cloud and looks ready to challenge the recent peak of 134.45, and possibly go beyond.
I went long at 132.01. The pair has found support with the 4-hour cloud and looks ready to challenge the recent peak of 134.45, and possibly go beyond.
4xpipcounter
Experienced member
- Messages
- 1,571
- Likes
- 30
Eur/cad
I went short at 1.3784. This might be the beginning of the strong reversal I mentioned in the earlier post. If not, then I'll take whatever the trade gives me. There is plenty of S on the way DOWN. The hourly tenken is 1.3745, kijun--1.3689, which will be a cluster event, 4hr--tenken--1.3676, and the kijun at 1.3621. Reaction at the latter could make a determination of how deep this thing will go.
I went short at 1.3784. This might be the beginning of the strong reversal I mentioned in the earlier post. If not, then I'll take whatever the trade gives me. There is plenty of S on the way DOWN. The hourly tenken is 1.3745, kijun--1.3689, which will be a cluster event, 4hr--tenken--1.3676, and the kijun at 1.3621. Reaction at the latter could make a determination of how deep this thing will go.
4xpipcounter
Experienced member
- Messages
- 1,571
- Likes
- 30
Re: GBP/JPY trade
I jumped in on this trade without paying attention to the fact I already had on posiiton up on it. I took the position out that I opened today at 132.40, which is good for +39 pips. This frees up some space for a position later, and in consideration I already have the other position on this pair up already.
I jumped in on this trade without paying attention to the fact I already had on posiiton up on it. I took the position out that I opened today at 132.40, which is good for +39 pips. This frees up some space for a position later, and in consideration I already have the other position on this pair up already.
I went long at 132.01. The pair has found support with the 4-hour cloud and looks ready to challenge the recent peak of 134.45, and possibly go beyond.
- Status
- Not open for further replies.