Some of my trades, forecasts

Status
Not open for further replies.
Ichimoku cluod II

First, the charts I post are only from my demo account. There are two basic reasons. Just in case something happens, I don't want my actual personal information showing up on the chart. Secondly, My S&R's are plotted according to the day starting at 6:00 PM EST. On my live account, they are plotted according to calendar day. I call them my "A" S&R's as a backup, and seldom do I need them.
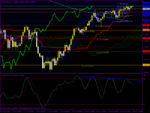
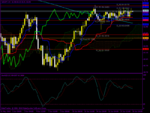
These two charts show why I am so high on the AUD/USD. It's a strong facsimilie on the NZD/USD. It was just today that the tenken cross over the kijun (I'll explain the tenken and kijun in another post.) on the daily. The pair will open on Monday in side the cloud, but will already be at the top. Once entering the cloud, any market will at least hit the opposite side. Notice the stochastics. It has already crossed above 85. When that happens, the objective is hitting both the kijun and tenken, which are currently .8453 and .8388. Another thing about the ichimoku is instead of it being a lagging inidcator, it allows you to look into the future. The future for the cloud is showing it is bearish and dropping. The candle has to catch up. These are overwhelming confluences just on the daily chart to show what we can expect.
I didn't post the weekly chart, but the candle is already inside of a huge cloud. .7827 is the bottom of the cloud, which is the minimum expectation. If price finishes the week under the cloud, then it will be another huge move DOWN.
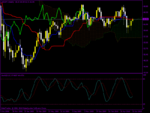
The thumb up shopws another personality of the ichimoku. Notice price mildly dropping, and then the tenken drops unde the kijun. Eventually price open unde both, then we had the broke into the cloud being followed closely by the TK. Price gets pushed out of the cloud then draws back. It meets massive R with the bottom of the cloud and the TK combo, then crashes. These are easy ichimoku trades.
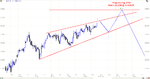
On the 4-hour, there is a triple divergence in OB condition on the stochastics. Price is also above the 200 MA. This is very uncomfortable elevation in an overall downtrend, with the current technical conditions.
Also notice my S&R's. They are proprietary. I have the software that plots them automatically. It was given to me by MY (Acronym to protect identity.). I'm still very grateful for him doing this for me.
Posts will be coming up that will go in detail and great specificities concerning the tenken, kijun, chinkou, the actual cloud, and some other surprises.
Most of thsoe posts will be a cut and paste from my blog.
 

Attachments

  • audusd--daily.bmp
    1.4 MB · Views: 143
  • audusd--h4.png
    audusd--h4.png
    51 KB · Views: 169
Nzd/jpy--s

Got another hot one here!
The 4-hour chart is first showing a sharp UP, and then it goes sideways. The tenken and kijun are also agreeing, and more and more is putting a pinch on the candles. The chinkou is getting ready to cross under the candles which is going to show the new downtrend. Stochastics has given out, and is strongly divergent. My MR1 at 64.34 has contained the UP.
The weekly tenken and kijun are all ganging up on the candle at the top of the cloud. The bottom of the cloud is 56.95, which is where price is headed.
The daily (not attached) has the stochs very OB and crossed over with the kijun at 61.52. The candle will neter the cloud at the top when the week ends, while being contained under the 200 MA.
This is unreal! If you know how to push the sell button on your platform, you will make lots of pips. Current price is 63.94, so it will be at least 699 pips.
 

Attachments

  • nzdjpy--4 hr.png
    nzdjpy--4 hr.png
    51.5 KB · Views: 161
  • nzdjpy--s weekly.png
    nzdjpy--s weekly.png
    45 KB · Views: 167
Do you take your direction from the weekly, daily or four hourly? Just a bit confused because it sounds like you're looking for a short entry on the AUDUSD however the tenken and kijum (which I've read are like a moving average crossover) seem to be pointing up on each timeframe which I thought would mean a buy? It depends on your timeframe but I would have thought most systems would have you long on the Aussie?
Sorry about all the questions, but one more thing. You say the Ichimoku isn't lagging. A lot of people criticise indicators for being 'laggy' without even understanding them, and they can be useful in the right situation. Isn't any indicator based on past prices lagging? I know the Ichimoku is displaced into the future but isn't it based on averages of past highs and lows, or the most recent close?
Its interesting reading your thread - you describe your method well and I'm sure its useful to diarise your thinking.
 
Bevok, First of all, no need to apologize for "all the questions". It's an old cliche, but I believe in it, "There are two dumb questions. The one you ask that you already know the answer to, and the one you don't ask. We all have different methodologies. Therefore, there is an element of unfamiliarity built in with all of them. The reason I love this forum is purely selfish. I love to challenged by interesting and insightful questions, such as yours, and it also reinforces my personal belief in my my method. In essence, you just keeop bringing your questions, and we will both benefit
In this case, all the TF's have strong obviations to go short. BTW, I'm also glad you feel the thread is interesting for you. That's my goal.
All 3 of the TF's have strong obviations for a short. The triple stoch divergence is on the 4-hour. The top of the cloud has been hit on the daily with momentum giving out, adn the stochastics is OB and has crossed, which means it is in for a plunge. The weekly has hit rock solid resistance at the combo of the tenken and kijun in a downtrend. The overall trend is still DOWN. This UP we have witnessed is only a correction to the DOWN. The reason I know it is only a correction and not an uptrend is because of the weekly cloud. 85% of the time when the candle enters one side of the cloud, it will at least hit the other. This means there is at least one more leg left on the DOWN. Because of those obviations, you cna use any TF to determine your entry for a short.
I have already entered a short on the AUD/USD at .8700. The problems with MA's (I do use the 200 MA). is that they are just that. A 200 measures the average of the closing of the last 200 candles, etc, etc. So, obviously, as the trend continues in one direction, so will the MA. The problem with that is that the trend will nmot continue forever, therefore, it pays to have a system that will show when there is going to be a reversal, also if it is the big trend, or just a correction, because there are implications with all of the scenarios. Based on what I elaborated on concerning the 3 TF's is why I have determined this is the end of the line for the UP.
I also understand that "most systems" would have me long. This is why I love my system (Not conceited, but I just believe whole-heartedly in my methodology. ).
Let me be clear that I would never criticize a system that contains the lagging indicators, nor do I criticize the indicators themselves. If a system produces 20 pips per month, it is a successful one, because it means it has a strong continuity of consistent gains. You are also right that any indicator is right for the right situation. Trading methodologies are personal and needed to be catered accordingly.
You might be right that all indicators are lagging, because they are based on past price action. I like to look at them more in terms of causation. Another words past price actions are related to the present in term of cause and effect. Yet, some, nevertheless, are lagging. An example is the RSI. I don't want to know anyone's views of the markets, but I was reading someone's views on the EUR/GBP when it was in the mid--.82's. He was saying because the RSI just broke into OS territory, price will really pick up to the downside. After the very next move the RSI didn't even look like it his OS territory. This is also why it is very hard to backtest these kinds of indicators. They tend to give headfakes, and then readjust after subsequent price action.
Your question was, "Isn't any indicator based on past prices lagging? I know the Ichimoku is displaced into the future but isn't it based on averages of past highs and lows, or the most recent close?" First, please keep reading this thread. There will be some points that I hope you will be pleasantly surprised over. But, let me give a brief synopsis of that question (I guess I'm never too godd at being brief.). First look at any chart, and find the half way point of the recent trend. Afterwards count up 26<> candles, and tell me what you see. You will be in the general proximity of the halfway point of the previous trend. The authors of the ichimoku had to have been geniuses. The chinkou is plotted back 26 candles. Once it crosses the candle that is another entry sign. This is because as a general rule 26 candles represents an entire cycle (The 26 can be a range of 26 to <> 34.).
Also the uniqueness of the ichimoku can also be seen on the daily for aussie. Notice how the tenken and the kijun did not follow the price action. Also, notice how the cloud is very bearish. If the ichimoku is lagging, it is hard for me to conceptualize its lagativity. This is really foretelling the move that is about to happen.
Another thing I like to use confluentially is the stochs with the ichimoku. On the daily the stochs are OB with a cross. It's amazing how much this happens, but when you get this happening, price always plunges to the tenken and kijun for that respective TF.
It is my opinion that it is dangerous to trade off of only one TF. What if the TF directly above it is contrarian to what you see on the TF you are viewing. This is why many traders enter a trade based on what they see on that TF, it takes off, partially ,then they wonder what happened when they get stopped out. This is a facsimile of what happened to me on the swissy I went long on and took a 1-point hit on it. I should have gottne out much sooner than I did, knowing what that the other TF's were still showing DOWN.
I hope that in part answers your questions. They were good ones and appreciated. Stay tuned for at least 5 more posts concerning the usage of the ichimoku.
 
Your thread is one of the few 'method related' ones I bother reading because you seem to have thought through your system very well - I'm certainly not looking for a system but I find the construction of trading ideas very interesting and you never know where you might come across an idea that is useful. Have you been trading this system long?
I think its vital to have a system based on sound market principles, and to understand why it works, whatever it is. I can see there are a number of factors influencing your estimation of direction, look forward to more about what your entry and exit triggers are and a few other elements.
 
You sound like an accomplished trader, so I can take your comments as genuine.
I started this thread for the purpose of enunciating my thoughts on my forecasts and sort of putting me on the spot with my trades. The reason is simple, and that is it creates a carefulness in my approach, and it is also biat for others to comment. Sometimes things are discovered that maybe I overlooked. Other times insightful questions will come up, such as the ones you asked that will force me to review my analysis and further imbed it in my psyche. A lot can be said for talking and writing about a subject, that eventually it just becomes a part of you .
Another point about the latter mentioned, and that is I'll never say that trading is easy. But, the one thing that happens with experience is that you spot thing on a fly. I even practice doing certain things without even thinking about it on my deom account, and a good percentage of the time it works out. Yet, I'm still cautious on my real account, even though I do put up a rather significant amount of trades, and I am not a scalper.
Like you, I believe any system needs to be enshrouded with sound market principles. It needs to be the trader's only defense. Admittedly so, I do not like to see threads where there is more hype, than sound logical trades. I believe many people do not like to post their actual trades, becausxe they are afraid of being wrong, and their ego is too big. This comes from not having complete confidence in their methodology. I am never afarid of being wrong, because I live and die (figure of speech) by my methodology. If I am wrong, I'm not afraid to admit, because even though I have an ego, it is not so big that I am not going to simply admit when I'm wrong. I think it also helps aspiring traders when they see the human side in a successful trader. It helps me, especially in this venue where we really don't know each other, to be able to build trust and confidence.
I'm also this confident in my methodology that it is never my methodology that failed me, but it is human error that intervened, and now it is time to fix what went wrong within myself.
As far as the "number of factors influencing my estimation of direction" is concerned, all that really is is a confluence of events that says, in this case, it is time to go short the AUD/USD. When I first started trading, I once read that 2, preferably 3 events needs to take place before making a trading decision. Therefore, the top of the cloud, stochs being OB, negative divergence on the stochs, my S&R's, placement of the kijun and tenken all played a bearing on this decision. Part of the guiding principle is that readers of this thread are not going to read about hindsight, or how I made 4,382 pips on a trade long after the event expired, or how I enter my trades and never have a pullback, or how I made 22,345 pips last week, or had some automated trading system where I went to the golf course and it did all my work for me, or how I spend 10 minutes a day trading and double my account every week. All of that is dishonest, hype, and implies to any aspiring trader that this is easy or it takes no work to develop. If it took me 3 solid years to fully develop a winning system for me, then I am sure I am not some exception to the rule, even though I never claimed to be the brightest light bulb in the room.
I started looking into trading, because my best friend and uncle became a millionaire off the markets. Even though he has been dead for 15 years, his life and example still seves as a high inspiration for me. He wsas in the stock market, but my general queries got my introduced to forex. I developed an immedaite love for it, and that was in July 2004. One of the worse things that happened could have happened to me did in that month. I made close to 100% on my demo in one week. I thought this was going to be easy. LOL
By May 2005, I had what I thought was a fully developed system. It was not. I was doing a lot better, but there was still issues.
2 major developments happened in the early part of 2007 that brought together for me, in my opinion, was the consumate trading methodology. I got introduced to the ichimoku cloud, and nothing made more sense to me. Just a short time thereafter someone was talking and discussing some formulas as it relates to the markets. I decided to get by myself and do some figuring. Thus, my pride and joy was born, and that is my proprietary set of mathematically influenced S&R's were born. It was through this that I understood that is is during the Japanese sesion that markets get their directives for the day, In the London session you mgiht get whipsawed because of the general volatility (glad I'm sleeping at that time), and it is during the NY sesison that markets say, "Okay we are suppose to go this way, and we will now behave ourselves. Thus, my dailies come into play as to where the target exit would be. Thew weeklies and monthlies play a vital role. My S&R's have personality (Give me time to prove this. I'm going to have posts that show how they work. It will blow the readers' minds.) all their own.
You are absolutely right when you say that the trader needs to understand how and why his indicators and the totality of his system works.
BTW, I see you are open to ideas. Let me refer you to another thread I think you might find interesting, "Elliot Wave EUR/USD" by Jah Dave. It is a plug for the originator of that thread only because it is also a principle enriched thread.


Your thread is one of the few 'method related' ones I bother reading because you seem to have thought through your system very well - I'm certainly not looking for a system but I find the construction of trading ideas very interesting and you never know where you might come across an idea that is useful. Have you been trading this system long?
I think its vital to have a system based on sound market principles, and to understand why it works, whatever it is. I can see there are a number of factors influencing your estimation of direction, look forward to more about what your entry and exit triggers are and a few other elements.
 
Zeph, the 4-hour chart is extremely OS. With the current outlook on the AUD, I would think now would be a good time .Right now we are at 1.4189, maybe lower depended on what time your broker quits for the week.
In the beginning it might be risky, because there are R's all over. If momentum gives out, I'll post it, then take whatever the market gives you. If your risk appetite is 500 pips, you should be safe. I just don't see it dropping that much more. After I said all that, you should know that I am not in that position. This is due in part to having 3 positions on the aussie and 1 on the kiwi. I don't want to load up anymore until those positions get moving in my favor.
As I understand it, you only have 2 positions open at 10% or less. If that is the case, then you are going to be okay, even if ti means taking from the market something quick. If my conjecture is wrong, then let me know before you get in.


I may have jumped in just a bit early on the eur_aud and the aud_usd. I tend to do that a lot because I see what's coming next in a wave pattern and get all excited and jump in without enough confirmation. Anyway, I took a good look at the Aussie today and just for fun put the exact top and time for the reversal based on Fibo numeric and time levels. Now you and I both know the chances of it hitting exact are very slim so don't be ridiculing me if it misses. I just wanted to make it public and see how close it gets. Also I will exit my .8700 Aussie trade if it gets to .8675 and try to sell it at the top of wave 5.
 

Attachments

  • AUD_06_19_2010_Hour.PNG
    AUD_06_19_2010_Hour.PNG
    26.4 KB · Views: 141
I'll never ridicule anyone for a forecast that is off or for a losing trade. That is just aprt of our industry.
Actually, my trade was absed on what I saw through the eyes ogf my methodology. I have huge respect for yours, but I'm still sticking to my forecast. Of course, I am here thinking "Jah Dave better be wrong." LOL


I may have jumped in just a bit early on the eur_aud and the aud_usd. I tend to do that a lot because I see what's coming next in a wave pattern and get all excited and jump in without enough confirmation. Anyway, I took a good look at the Aussie today and just for fun put the exact top and time for the reversal based on Fibo numeric and time levels. Now you and I both know the chances of it hitting exact are very slim so don't be ridiculing me if it misses. I just wanted to make it public and see how close it gets. Also I will exit my .8700 Aussie trade if it gets to .8675 and try to sell it at the top of wave 5.
 
4x, Thanks for all the info you are sharing on your thread. I am still self employed and am trying to make it as a full time trader and then sell my printing company. I have only been trading about three years and have read books from all across the financial market spectrum and Elliott Wave Theory impressed me the most.. I have been studying it now for about two years and still make plenty of mistakes, but as you, I thought a thread would help me develop as a trader and hopefully help other people as well.
 
You have been doing an excellent job. In backchecking your analysis, you've been very accurate. I also like the positiveness that your analysis conveys. As always, none of us will be right 100% of the time, but I'm sure you have been right in your trading decisions more than you have been wrong.
BTW, if this is not the beginning of the trend for the EUR/AUD, I see at least a recovery to 1.4251. This is because on the hourly the stochs is OS and crossed, along with a perfect bounce off my DS2, and the kijun is the 1.4251 mark. That's not a lot of pips, but the hourly is the only chart giving me any indication of any certain move. Well, the monthly is too, but that doesn't help until the trend becomes officialized.


4x, Thanks for all the info you are sharing on your thread. I am still self employed and am trying to make it as a full time trader and then sell my printing company. I have only been trading about three years and have read books from all across the financial market spectrum and Elliott Wave Theory impressed me the most.. I have been studying it now for about two years and still make plenty of mistakes, but as you, I thought a thread would help me develop as a trader and hopefully help other people as well.
 
Ichimoku cloud III

Even though this is my 3rd in a series on a series of lessons on the ichimoku cloud, this is the first that is going to describe the basic components of the ichimoku.
The blue line is the tenken sen (tenken for short).
The red line is the kijnu sen (kijun for short)
When I refer to the TK cross, it is in reference to when the tenken cross over or under the kijun.
The lime line is the chinkou span (chinkou for short).
The chinkou is plotted, relative to current price, 26 candles in back of the current price.
When the cloud is green, and pointing up, it is bullish, and when it is brown and pointing down, it is bearish.
The cloud continues into the future (that is past current price) to give an idea where price may be in the future.
BTW, this was already foetold to the readers in my blog that a huge correction was going to take place. The drop was going to hit the weekly kijun at 1.0939. I use the stochastics as a confluence. As described in another post, when it crosses when extremely OB price will find its way to the kijun on that TF.
These parts of the lessons will not cover the stochastics and its confluence as per se. But, I might make points along the way that do not pertain to the lesson, itself.
Another thing. I use the term "lesson" because of a lack of better terms. I hope that does not sound condescending.
 

Attachments

  • usdchf weekly.bmp
    1.4 MB · Views: 144
Hey 4x, The Aussie certainly did not take until wednesday to top out LOL, the fibo level was very close ( within 23 points). I think that was the top so I got back in short at about 5:30 at .8809 with no stop. Every indicator I have and my elliott wave count shows a reversal, so here we go.
 
Last edited:
Dave, I just got to the computer and was getting ready to acknowledge that you were right on. I should have listened to the Maherajah of the Elliot Wave.
I attahced a chart of the 4-hour of the aussie. I wanted to show my MR1 is at .8801. For the life of me, I thought it was out of the question it would be hit because of all the examples and confluential indications I gave.
The other reason is that I do not remember the last time we had a quadruple negative divergence.
Also, concerning the cloud on the daily. Bouncing of the top with no spike always looks good, and really I did not think it had anywhere for it to go beyond the top. The cloud is still legitimizes the move as long as we have a daily close under .8730, which is the top. That way, the wick only sticks out.
The candle also hit the top of the weekly chart (Yes, much to my surprise.). Price action needs to get under .8694 (tenken) quick.
Again, good call, Dave. Glad you posted your chart here.
 
If Ichi is like Elliott Wave the moves with the most momentum that push things to the limit are the same ones that scream the other way when they get going. It wouldn't surprise me to see it make one more desperate attempt up.
 
I don't like the way the tenken crossed the kijun on the daily, but the OB/OS conditions are ready to explode. Also, with my MR1 at .8801, I don't know how it is going to ignore it. Time will tell.
 
Here's the S&R's for the week of June 20,2010

I'm late with them. I did the 11 most popular pairs along with gold. The latter was for you Hari. They were handwritten and scanned. I have a software program that automatically plots my S&R's on my chart. All I have to do is wait for the week to start, then copy them. So that's what I was doing, and didn't want to take the time to type them. For most people, my handwriting is readable.
I will do a series on my S&R's once I am done with the ichimoku cloud.
 

Attachments

  • S&R's for week of June 20, 2010.JPG
    S&R's for week of June 20, 2010.JPG
    1.3 MB · Views: 154
More on the aussie and the kiwi

I'm going to hammer this so much, I'll have everyone turning me into the administrators.
It is blowing my mind to see not just a confluence of events for the bears to take over, but a whole litany. Also,because both pairs popped above the daily cloud, it will provide additional support on the way DOWN, which may be why the reversal is still a little slow going. Today's range for the aussie is 106, and the kiwi is 81, but I still wanted the respective WS1's hit at .8720 and .7047, respectively. OTOH, both pairs had to continue further north, so that had a part to do with thsoe reference points not getting hit. It did cover the week's cycle period as the range between my S&R points at the lower levels is 81 and 72, respectively.
I guess it is one of those things about trading. You know your LT projections are right, but you get antsy waiting for the whole thing to unfold. Admittedly so and can be documented in this thread, I 've been holding on to some negative live trades a little too long. Of course, I will still be reporting excellent positive gains, once out of the woods.
Here's some supports to look for on the way:
AUD/USD--.8622 daily tenken and bottom of the cloud; .8461--daily kijun; .7827--weekly bottom of the cloud.
NZD/USD--.6972--daily tenken and top of the cloud; .6855--daily kijun; .6262--bottom of the weekly cloud
 
Eur/usd

This pair is not back in its DOWN. This is a retracement of the correction of the downtrend. The stochastics are OB on the daily. This means the the tenken and the kijun both get hit. The tenken already got hit today, and the kijun is at 1.2219. There will also be a cluster event in that area as the WS2 is 1.2235, and there will also be a meeting with the top of the 4-hour cloud in that circa area.
 

Attachments

  • eurusd--daily.bmp
    1.4 MB · Views: 121
Usd/jpy

90.88 is a huge cluster support area. If price gets around this area, additional momentum will pick up on the fall. We could also be on our way back up. I'm saying it is 60-40 right now. I slightly favor a reversal. This is because during the low volume times of the Japanese session, the indicators will catch up, then when it's time to dance, we're headed north.
still, for me, this is too risky.
 
Gbp/usd

The top of the 4-hour cloud is support at 1.4715 Additional support is at the DS1 at 1.4706. Just in case price breaks throguh that area, then expect the bottom of the cloud at 1.4600 to be containment. The next upside target should be WR1 at 1.4954
 

Attachments

  • gbpusd 4hr.bmp
    1.4 MB · Views: 130
Last edited:
Status
Not open for further replies.
Top